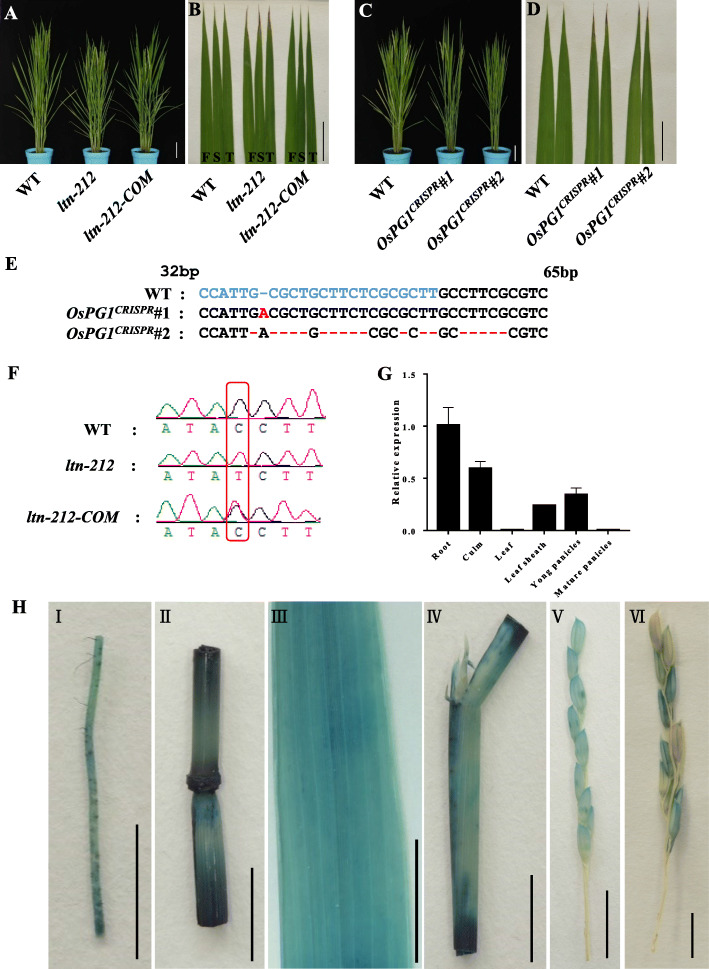
Fig. 5.
Genetic complementation, knock-out and expression analysis of OsPG1. a Phenotype of WT, ltn-212 and T1 complementation plant (scale bar = 10 cm). b Leaf tip necrosis disappear on the leaves of T1 complementation plant (scale bar = 5 cm). c Phenotype of WT, and OsPG1 knock-out individuals (OsPG1CRISPR#1, OsPG1CRISPR#2) at JiaHe212 background (scale bar = 10 cm). d Leaf tip necrosis on the leaves of knock-out individuals (OsPG1CRISPR#1, OsPG1CRISPR#2) (scale bar = 5 cm). e Mutational sites of knock-out individuals (OsPG1CRISPR#1, OsPG1CRISPR#2). The blue color words indicate target sequence and the red color words indicate insertion and deletion mutations. f The T1 transgenic plants were verified by sequencing of the mutation site. g Expression levels of OsPG1 in various tissues (n = 3). h Gus staining of OsPG1 promoter–GUS reporter transgenic plants (scale bar = 1 cm). I: Roots. II:Colum. III: leaf. IV: Sheath. V: Young spikelet. VI: Mature spikelet. Data are means ± SD. ** indicates significance at P ≤ 0.01 and * indicates significance at P ≤ 0.05 (Student’s t test)

