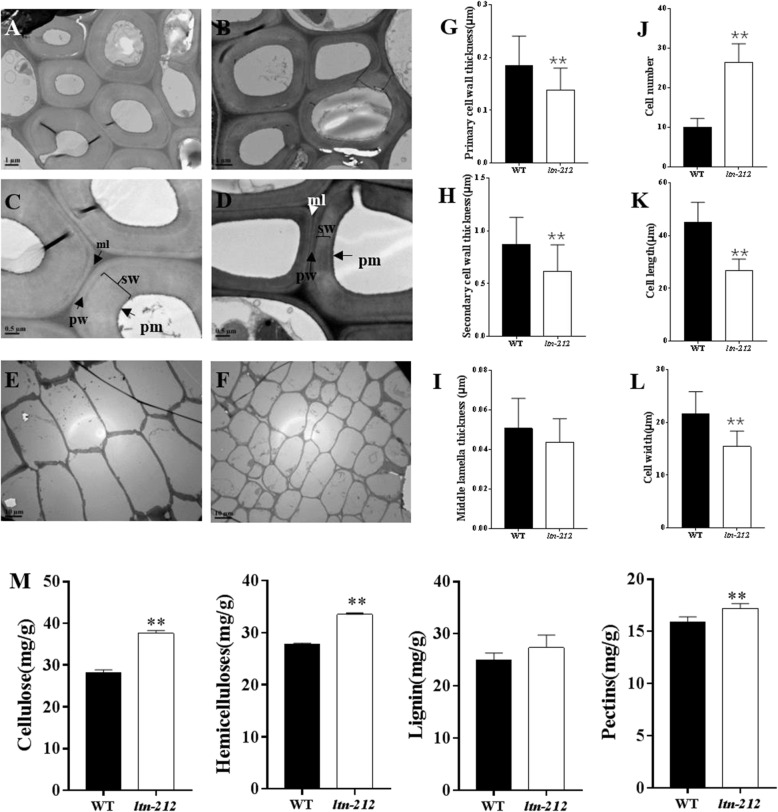
Fig. 6.
Cell wall structure in WT and ltn-212. a-b TEM micrographs of the bundle sheath fiber cells in leaves of WT (a) and ltn-212 (b) (scale bar =1 μm). c Magnification in (a), and D. magnification in (b) (scale bar = 0.5 μm). E-F. TEM micrographs of the internode cell of WT (e) and ltn-212 (f) (scale bar = 10 μm). g-i Statistical analysis of the primary cell wall, secondary cell wall, and middle lamella thicknesses of bundle sheath fiber cells in leaves of WT and ltn-212. Data are means ± SD of 20 cells. j-l Statistical analysis of the cell number, cell length and cell width of WT and ltn-212. Data are means ±SD of 30 cells. m The cell wall composition of WT and ltn-212 (n = 5). ** indicates significance at P ≤ 0.01 and * indicates significance at P ≤ 0.05 (Student’s t test). ml: middle lamella, pw: primary cell wall, sw: secondary cell wall, pm: plasma membrane

