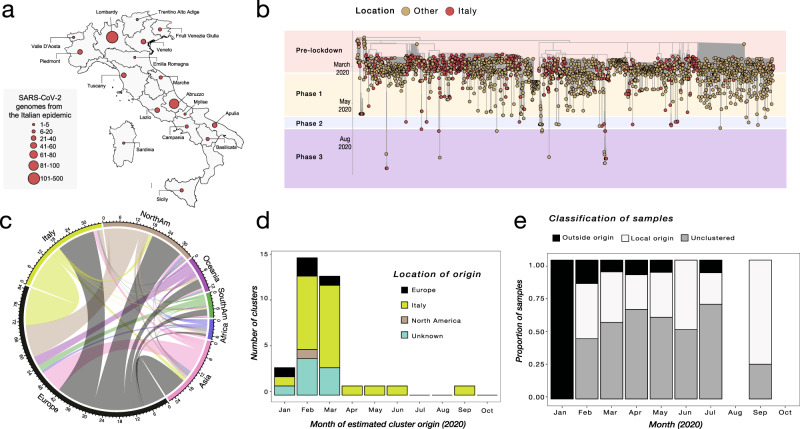
Fig. 3. Phylogenetic characterization of Italian SARS-CoV-2 sequences.
a Map of Italy showing the number of SARS-CoV-2 genome sequences by region. The size of the circles indicates the number of new genomes available since the beginning of the epidemic in Italy. b Time-resolved maximum likelihood tree of 1421 SARS-CoV-2 sequences including 714 from Italy (red circles). c Chord diagram of estimated numbers of migration flows between the geographic areas. d Frequency of estimated geographical origins for identified transmission clusters involving Italy and originating in the months of January through October of 2020. e Frequency of Italian sequences (sampled from January through October) classified as unclustered (gray) or belonging to clusters with Italian (white) or non-Italian origins (black).

