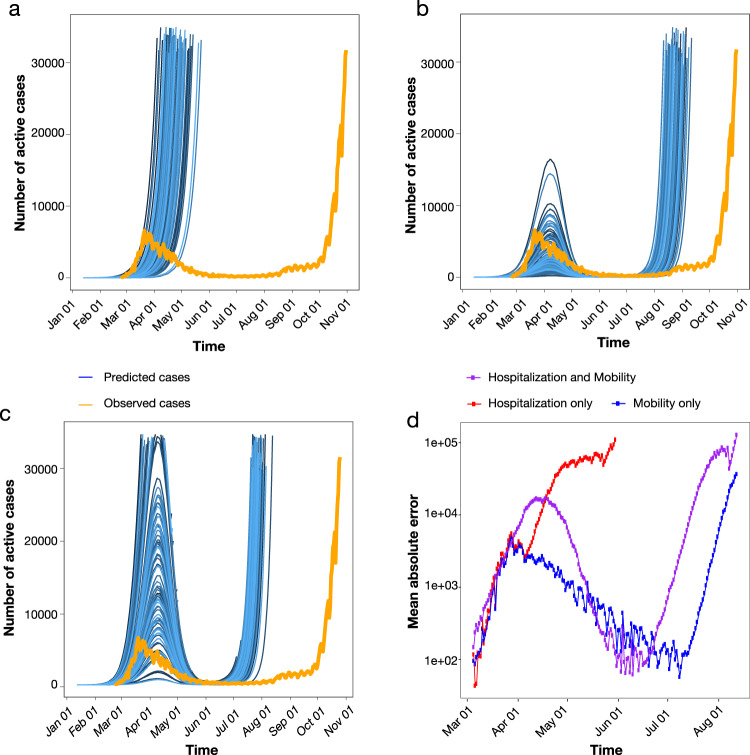
Fig. 5. Simulated epidemics under scenarios involving time-varying mobility and hospitalization rates.
a The probability of removal of an infected individual was proportional to the empirical rate of hospitalization in the simulation of active infected cases over one year (blue). b The number of individuals with whom an infected individual comes in contact was proportional to the empirically determined number of individuals utilizing walking, as well as public and personal modes of transportation, as primary means of mobility in the simulation of active infected cases over one year (blue). c Hospitalization rates (as in A) and mobility data (as in B) were combined in the simulation of active infected cases over one year (blue). In a–c, orange represents the number of empirically observed infections. d The absolute error was calculated for each time point of collected observations between simulated infections using hospitalization rates only (red), mobility data only (blue), and the combination (purple). Mean absolute error was calculated as the averaged error across 1000 simulations. Simulation assumed a single outside introduction.

