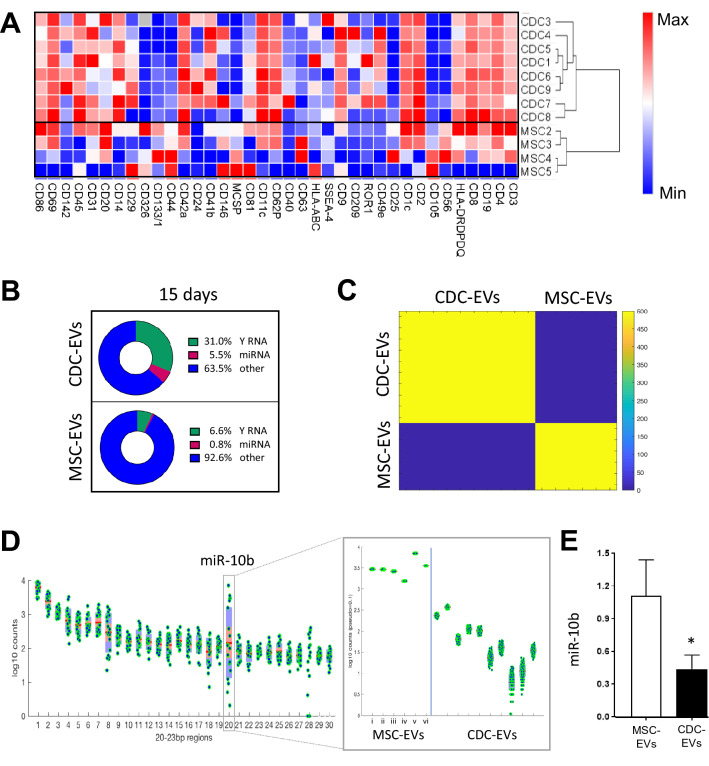
Figure 2.
Compositional differences between CDC-EVs and MSC-EVs. (A) Relative differences in protein surface marker expression between CDC-EVs (n = 8, 15 days serum-free media) and MSC-EVs (n = 4, 15 days serum-free media). (B) Non-coding RNA distribution in EVs (CDC-EVs [n = 10, 15 days], MSC-EVs [n = 3, 15 days; n = 3, 48 h]). (C) Differential K-means clustering of miRNA in CDC-EVs and MSC-EVs. (D) miRNA analysis of CDC-EVs and MSC-EVs revealed a significant increase in expression of miR-10b in MSC-EVs compared to CDC-EVs. (E) Quantitative qPCR analysis of miR-10b in EVs. Results are presented as mean ± SEM. CDC-EVs (n = 10); MSC-EVs (n = 4), unless noted otherwise. Statistical significance was determine using the Mann–Whitney test, *P < 0.05.

