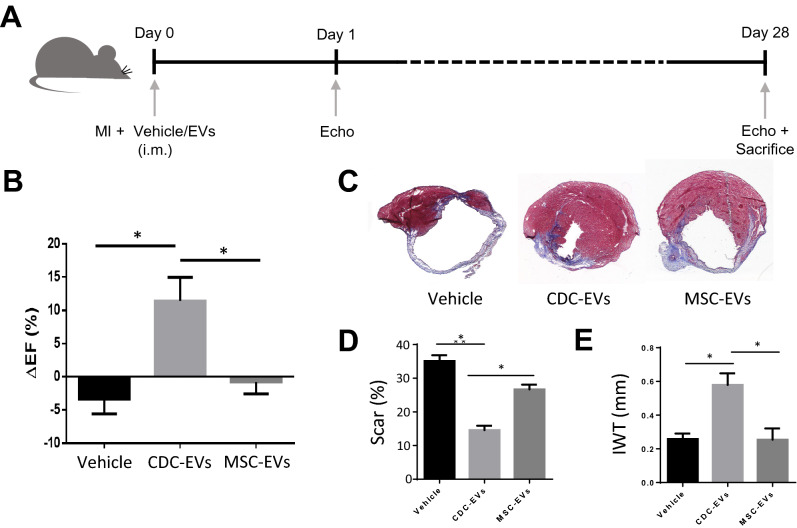
Figure 3.
Therapeutic efficacy of EVs in a mouse model of MI. (A) Schematic overview of the in vivo MI mouse model. Figure was generated using Microsoft PowerPoint (https://www.microsoft.com/en-us/microsoft-365/powerpoint); i.m.: intramuscular. (B) Percent change in ejection fraction (ΔEF) between days 28 and 1 post-MI. (C) Representative images of Masson’s trichrome staining. (D) Quantitative analysis of scar size in (C). (E) Quantitative analysis of infarct wall thickness (IWT) in (C). Results are depicted as mean ± SEM. Statistical significance was determined using 1-way ANOVA followed by Tukey’s multiple comparisons test. *P < 0.05.

