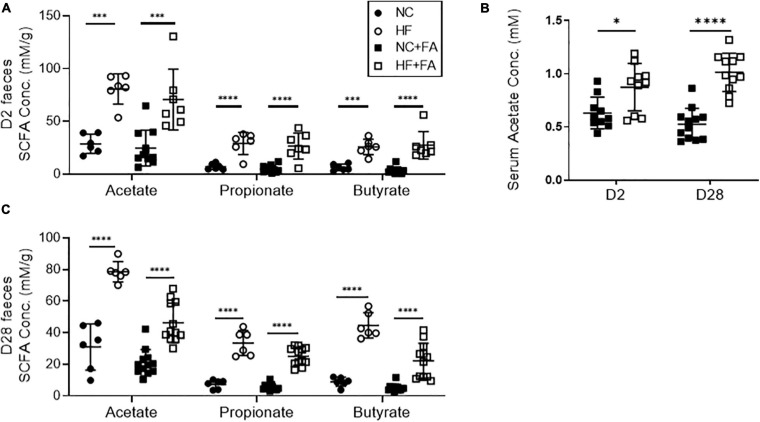
FIGURE 4.
Quantification of SCFA levels in feces and serum by 1H-NMR spectroscopy. HF fed mice had significantly higher levels of fecal SCFAs (A) and serum acetate (B) at day 2 post FAN induction compared to NC fed counterparts. This diet-induced increases in SCFA concentrations were sustained to day 28 (C). FAN (n = 7–12); non-FAN (n = 6). Data are shown as means ± SD; ∗P < 0.05, ∗∗P < 0.01, ∗∗∗P < 0.001, ****P < 0.0001.

