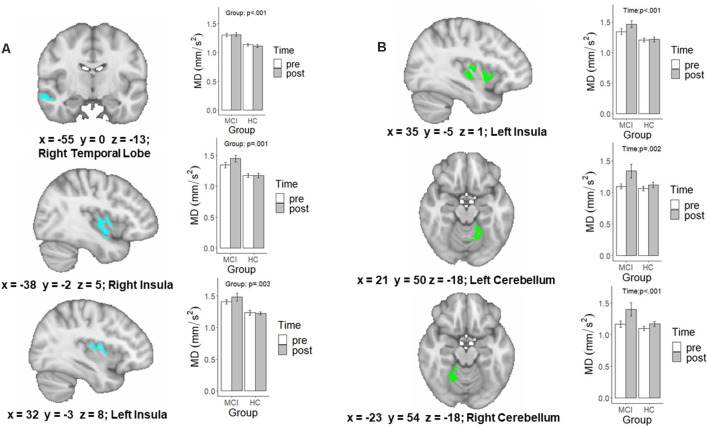
Figure 2.
A map of the significant family-wise error (FWE) and age-corrected voxel-wise analysis of the (A) main effect of Group and (B) main effect of Time. Extracted values in the bar graph are raw diffusion values and not adjusted for age. p-values are the result of running these raw diffusion values through a similar linear mixed effects model, in which age was controlled for.

