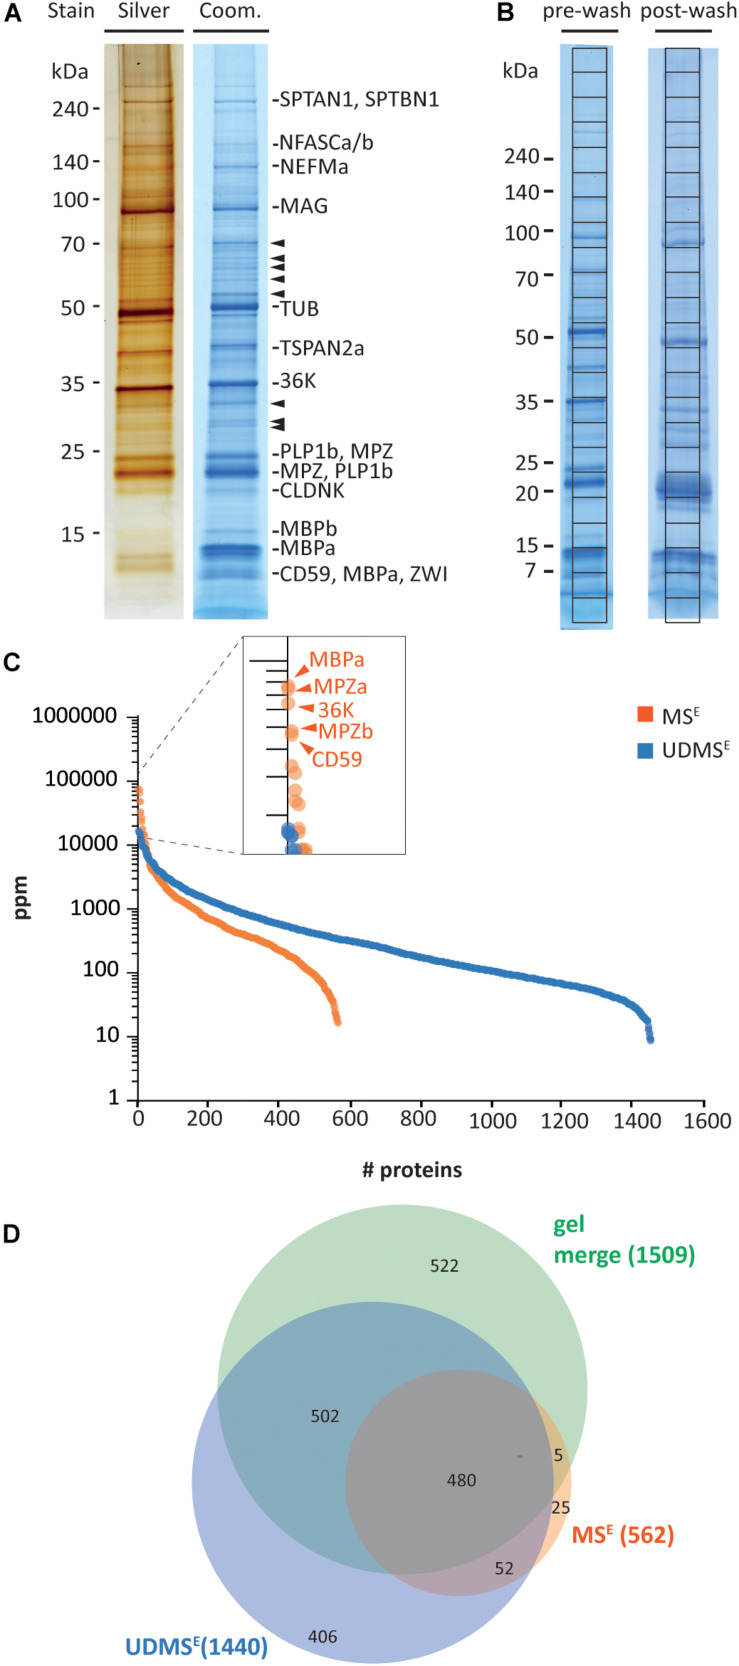
FIGURE 1.
Proteome analysis of zebrafish myelin. (A) One-dimensional separation of myelin biochemically purified from brains and optic nerves of adult zebrafish. Myelin was separated by 1D SDS-PAGE on Tris-glycine gradient gels, and proteins were visualized by silver staining (0.5 μg load) or colloidal Coomassie (CBB250; 5 μg load). Bands are annotated that mainly comprise known myelin proteins according to mass spectrometric identification. Arrowheads indicate bands in which no known myelin proteins were identified. (B) Myelin separated on Tris-glycine gradient gels (5 μg load) before (pre-wash) or after (post-wash) an additional step of high-pH and high-salt conditions. The indicated grid divides each CBB250-stained lane into equally sized slices, which were excised for automated tryptic digest and LC-MS analysis, thereby, respectively, identifying 890 (pre-wash) and 1274 (post-wash) proteins (Supplementary Table 1). (C) Number and relative abundance of proteins identified and quantified in purified myelin by in-solution digestion and two data independent acquisition MS modes, MSE and UDMSE. Note that MSE (orange) identifies fewer proteins but provides a higher dynamic range for quantification of proteins in purified myelin compared to UDMSE. MSE thus facilitates quantification of highly abundant myelin proteins. ppm, parts per million. (D) Venn diagram comparing the number of proteins identified in myelin by MSE, UDMSE, and gel-based approaches.

