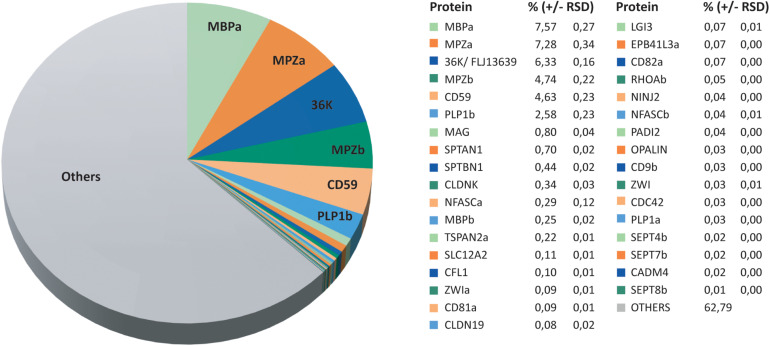
FIGURE 2.
Relative abundance of CNS myelin proteins in zebrafish. Pie chart visualizing the MSE dataset (Figure 1C and Supplementary Table 1). The relative protein abundance is given in percent with relative standard deviation (RSD). Note that known myelin proteins constitute about 37% of the total myelin protein, whereas proteins so far not associated with myelin constitute the remaining 63%.

