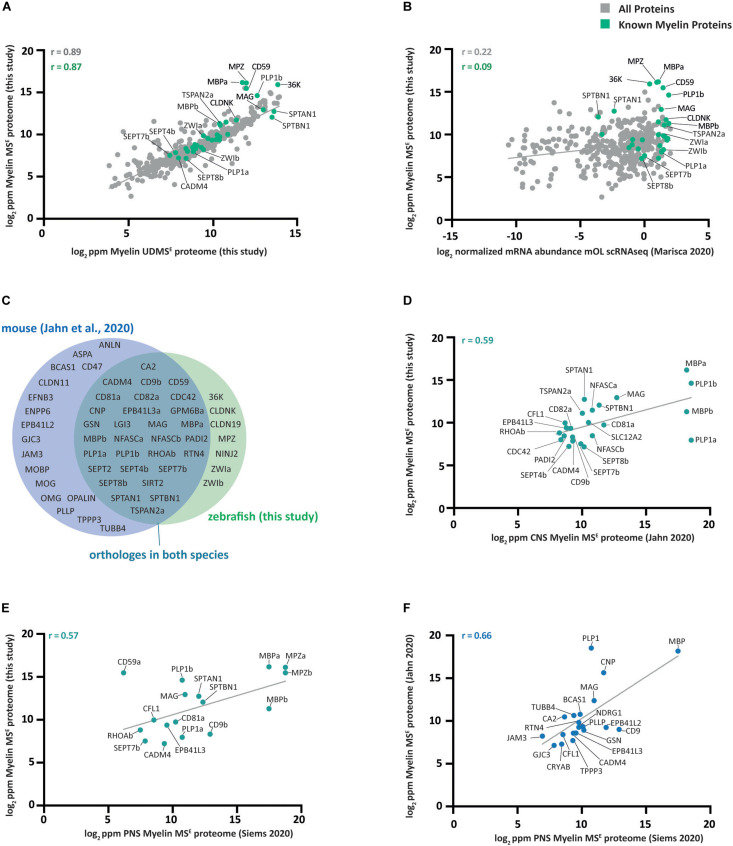
FIGURE 3.
Comparison of the zebrafish myelin proteome with other datasets. (A) Scatter plot of the log2-transformed relative abundance of proteins identified in this study by MSE in zebrafish CNS myelin against those identified by UDMSE. Data points representing known myelin proteins are labeled in green; other data points are in gray. The correlation coefficient was calculated for known myelin proteins (green) and for all proteins (gray) identified using both MS modes. The linear regression line is plotted for all proteins. ppm, parts per million. (B) Same as (A) but plotted against the scRNA-seq-based transcriptome of mature zebrafish oligodendrocytes (mOL) according to the normalized mean of all 19 cells in the mOL cluster according to prior assessment of oligodendrocyte lineage cells (Marisca et al., 2020). (C) Venn diagram comparing known myelin proteins identified in zebrafish CNS myelin in this study with those previously identified in CNS mouse myelin (Jahn et al., 2020). If a paralog has been reported in zebrafish, the protein name of the paralog is given. (D) Same as (A) but only known myelin proteins identified by MSE in zebrafish myelin are plotted against the CNS myelin proteome of c57Bl/6N mice as previously assessed by the same mode (Jahn et al., 2020). Only proteins present in both datasets are plotted. (E) Same as (D) but known myelin proteins identified by MSE in zebrafish CNS myelin are plotted against the mouse PNS myelin proteome as previously assessed by the same mode (Siems et al., 2020). (F) Same as (D) but known myelin proteins identified by MSE in mouse CNS myelin mode (Jahn et al., 2020) are plotted against those identified by MSE in mouse PNS myelin (Siems et al., 2020).

