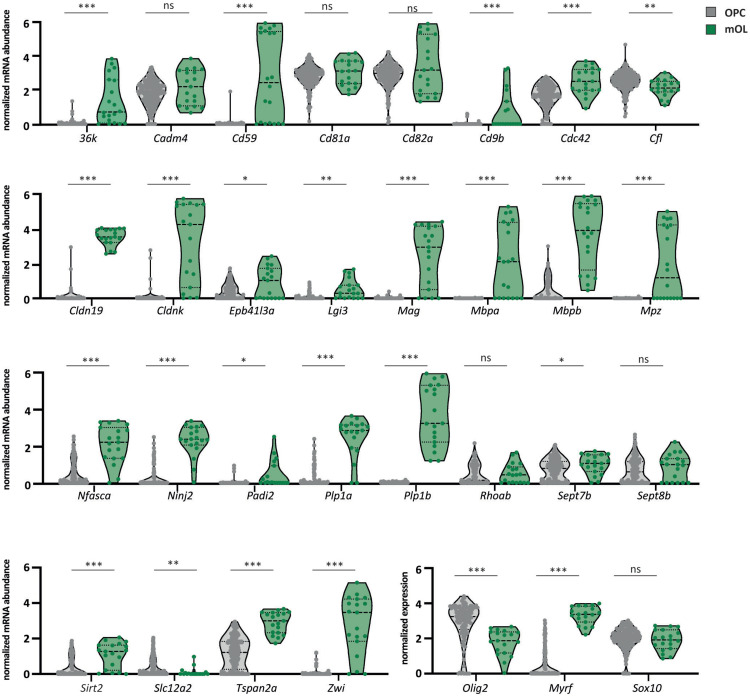
FIGURE 4.
Expression of myelin-related mRNAs in OPCs and mature oligodendrocytes. Violin plots comparing the relative abundance of selected myelin-related transcripts in OPCs and mature oligodendrocytes according to a previously established scRNAseq dataset (Marisca et al., 2020). Data are given as normalized log-transformed mRNA abundance in transcripts per million (TPM) in OPCs (gray) versus mature oligodendrocytes (mOL) (green). Median with interquartile ranges; n = 189 OPCs (combined clusters 1–4 in Marisca et al., 2020) versus n = 19 mOL (cluster 5 in Marisca et al., 2020); ∗p < 0.05, ∗∗p < 0.01, ∗∗∗p < 0.001 by Welch’s t-test. For precise p-values, see section “Materials and Methods.” The mRNAs for oligodendrocyte transcription factor 2 (olig2), myelin regulatory factor (myrf), and SRY-box transcription factor 10 (sox10) serve as markers. ns, not significant.

