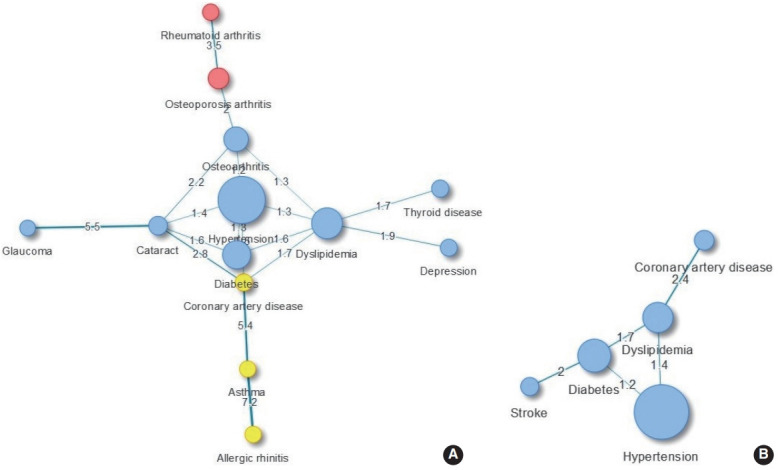
Figure 2.

Comorbidity network in obese female (A) and obese male (B) over 45 years of age. Node size is proportional to the prevalence of the corresponding comorbidity. Same-colored nodes indicate the same cluster. Edge thickness indicates the observed-to-expected ratio value for connected conditions.
