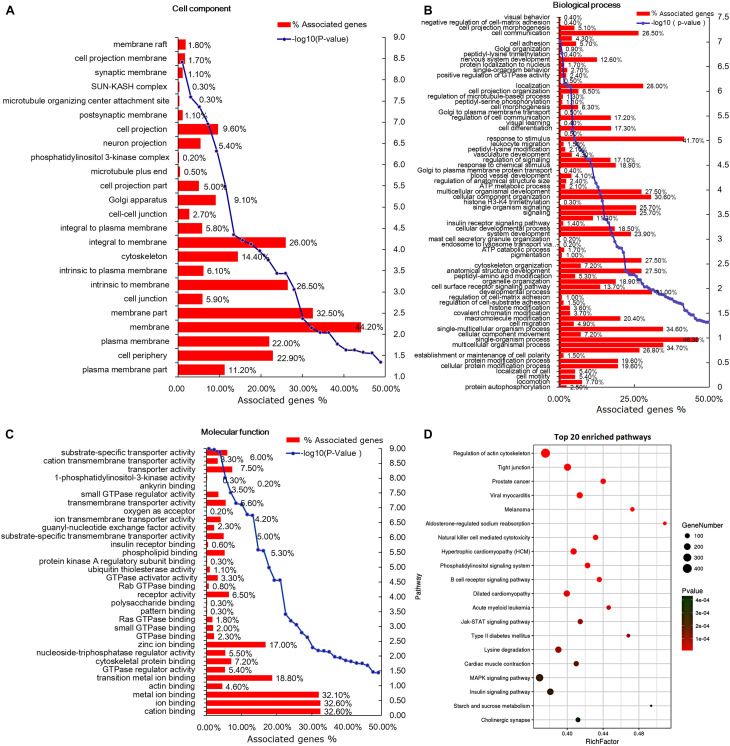
FIGURE 5.
Gene ontology (GO) and Kyoto Encyclopedia of Genes and Genomes (KEGG) analysis of the differentially expressed genes (DEGs). (A) Cell component-based classification of DEGs. (B) Biological process-based classification of DEGs. (C) Molecular function-based classification of DEGs. (D) The top 20 enriched signal pathways of DEGs. The circle size represents the number of genes and the color signifies P-value.

