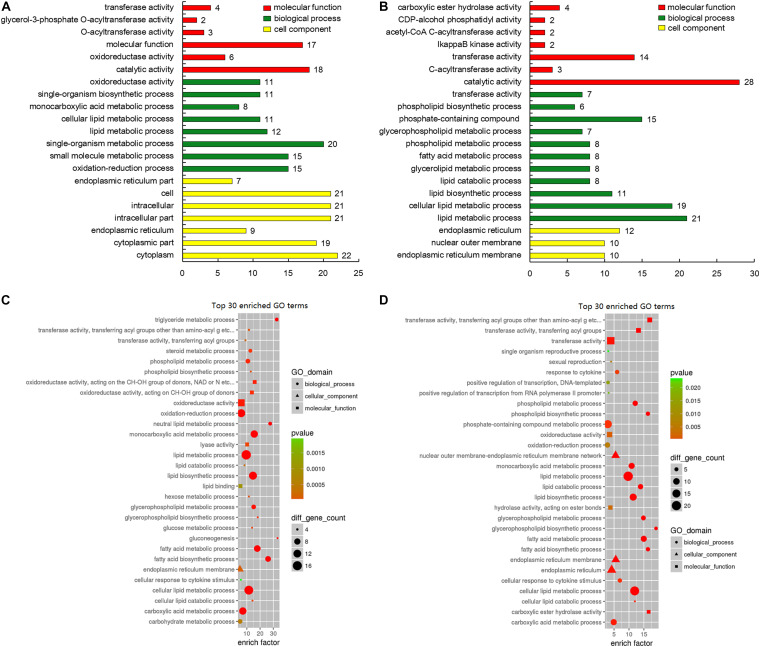
FIGURE 6.
Gene ontology (GO) analysis of genes involved in lipid deposition-related regulation. (A) GO classification of upregulated genes (red, molecular function; green, biological process; yellow, cell component). (B) GO classification of downregulated genes (red, molecular function; green, biological process; yellow, cell component). (C) GO enrichment of the top 30 lipid metabolism-related upregulated genes. The circle size represents the number of genes involved in “biological process,” triangle size represents the number of genes involved in “cell component,” and square size represents the number of genes involved in “molecular function.” The color represents the P-value. (D) GO enrichment of top 30 lipid metabolism-related downregulated genes. The circle size represents the number of genes involved in biological process, triangle size represents the number of genes involved in cell component, and square size represents the number of genes involved in molecular function. The color signifies P-value.

