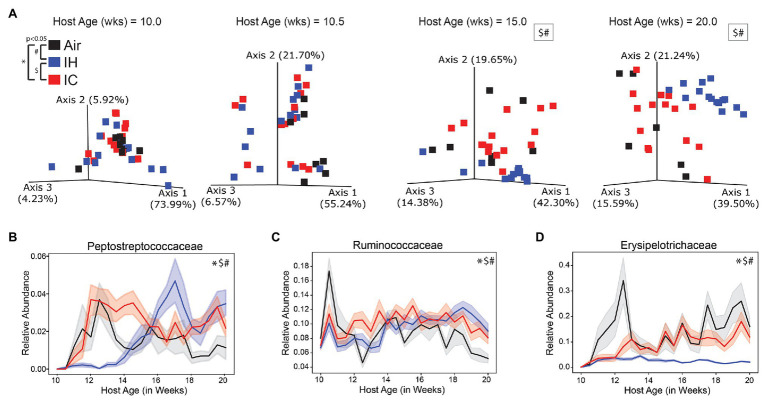
Figure 2.
16S microbiome of ApoE−/− mice on HFD during chronic 10-week treatment. (A) Weighted UniFrac PCoA of the microbiome during four key time points, each time point calculated in isolation. Longitudinal relative abundance values for (B) family Peptostreptococcaceae; (C) family Ruminococcaceae; and (D) family Erysipelotrichaceae. PERMANOVA used for statistical comparisons at the population level. Linear mixed effect (LME) modeling used for statistical comparisons of individual families over time. The shaded areas in parts (B–D) represent standard error of the mean. Air/controls are black (n = 6), IH is blue (n = 12), and IC is red (n = 12). Statistical significance p < 0.05, *IC vs. Air, #IH vs. Air, and $IH vs. IC.

