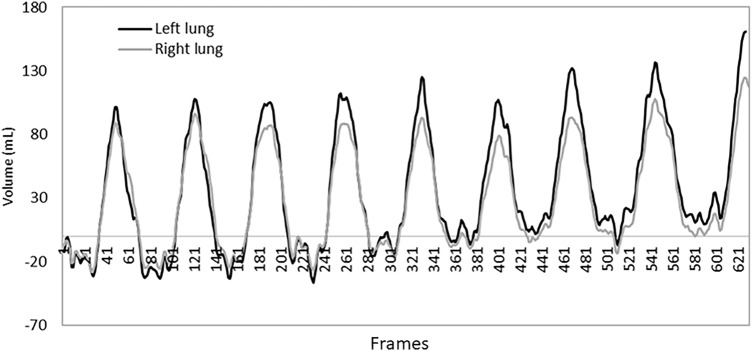
Fig. 2.
Monitoring of the left and right hemithoraces. Regional ventilation monitoring of the left and right patient’s hemithoraces is depicted. The volume time curve is obtained by analyzing the right and left hemithoraces ROIs separately. The black curve corresponds to the volume time curve of the right thorax and the gray curve corresponds to the volume time curve of the left thorax. Such analysis may enable to depict regional abnormalities such as atelectasis and/or pneumothorax

