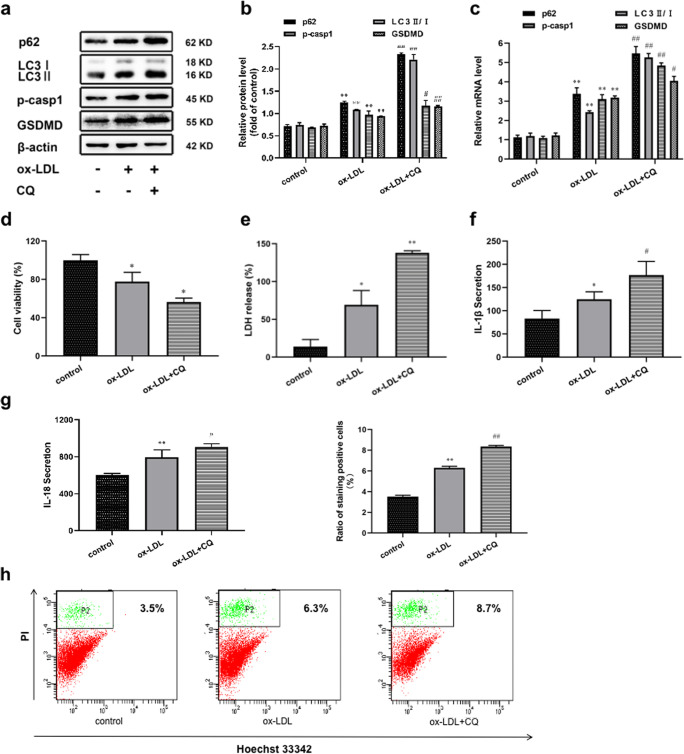
Fig. 2.
Autophagy blockage triggered pyroptosis and inflammation in macrophages exposed to ox-LDL. Cells were divided into the following treatment groups: control, ox-LDL (75 μg/mL), and ox-LDL+CQ (50 μM). (a, b, c) p62, LC3II/I, p-casp1 and GSDMD levels were detected by Western blotting and qRT-PCR. (d) Cell viability and (e) LDH release were performed in each treatment group. (f, g) The levels of IL-1β and IL-18 were assessed by ELISA. (h) The percentage of pyroptosis by using FCM. Values are expressed as the mean ± SEM (n = 3) of independent experiments at least 3 repeated measurements. *p < 0.05 and **p < 0.01 different from the control group, #p < 0.05 and ##p < 0.01 different from the ox-LDL-treated group

