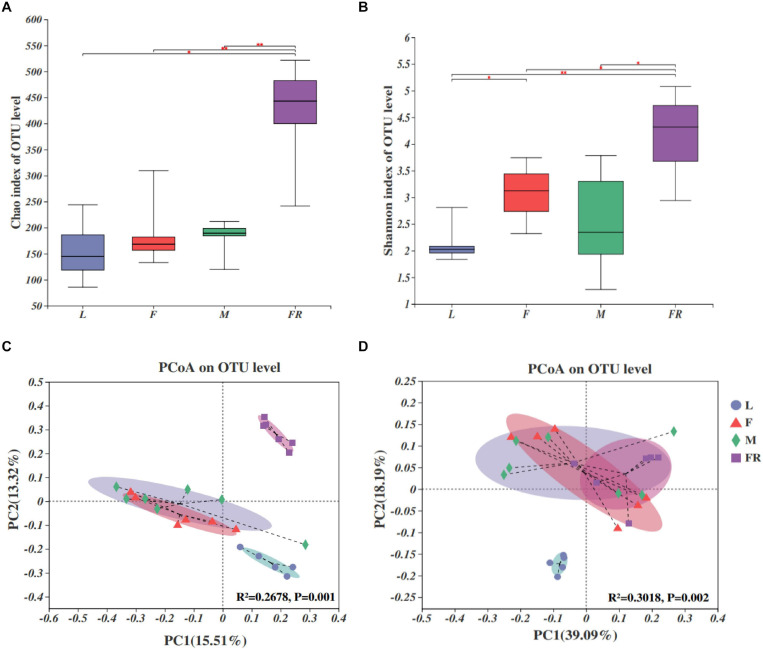
FIGURE 2.
Bacterial communities in the Sirex noctilio gut and frass. Boxplots of (A) species richness (Chao index), and (B) species diversity (Shannon index). The significant differences of alpha diversities were analyzed using Wilcoxon rank-sum test (∗0.01 < P ≤ 0.05, ∗∗0.001 < P ≤ 0.01). (C) Unweighted and (D) weighted UniFrac-based PCoA plots of bacterial communities. The significant differences in beta diversities were analyzed using adonis analysis with 999 Monte Carlo permutations (L, larva; F, female; M, male; and FR, frass).

