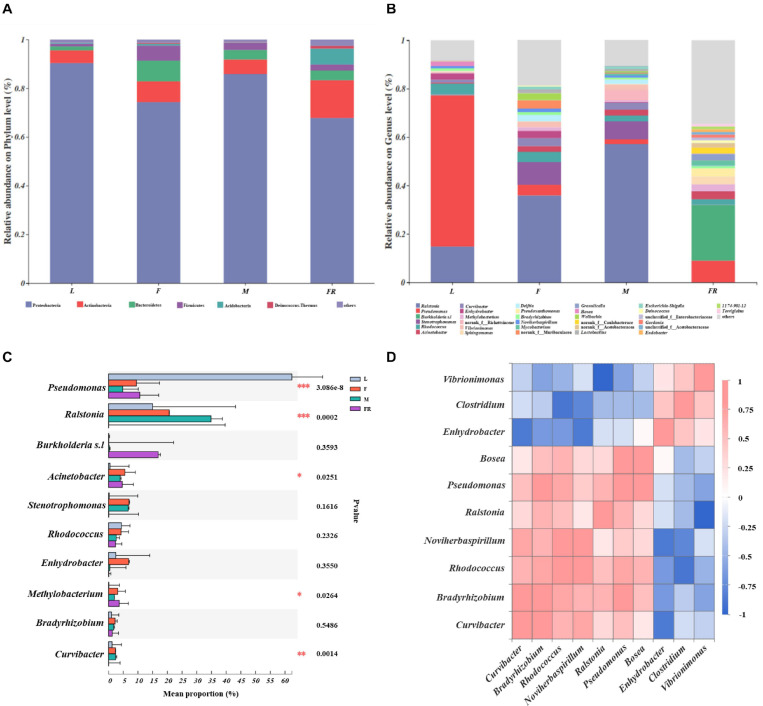
FIGURE 3.
Taxonomic composition of bacterial communities associated with Sirex noctilio gut and frass. Relative abundance of each bacterial (A) phylum, and (B) genus. Each bar is indicated by a different color at phylum and genus level. OTUs that were <1% of average relative abundance in groups are summarized as “others”. (C) Significant differences of microbial composition in larvae, female adults, male adults, and frass in the relative abundance of top ten (one-way ANOVA followed by Scheffe test; ∗0.01 < P ≤ 0.05, ∗∗0.001 < P ≤ 0.01, ∗∗∗P ≤ 0.001). (D) Spearman correlations of samples with the OTU abundance of genus in S. noctilio larval gut in the relative abundance of top ten. Blue boxes represent co-exclusion/negative correlations; red boxes represent co-occurrence/positive correlations between microbes (L, larva; F, female; M, male; and FR, frass).

