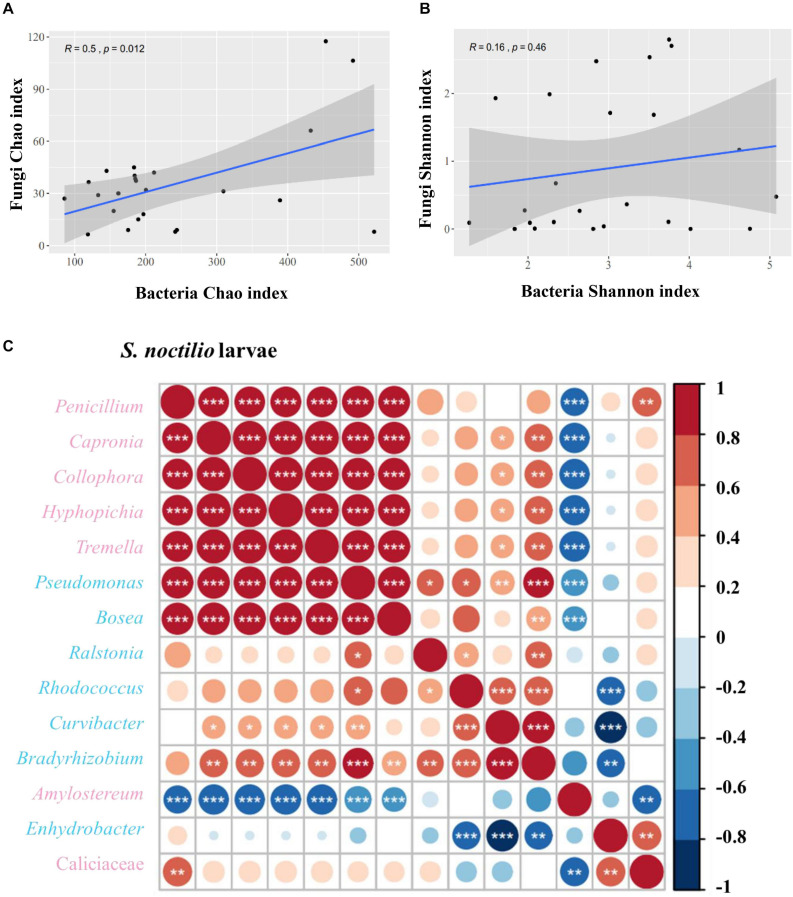
FIGURE 6.
Correlation of bacterial and fungal alpha diversity indices in Sirex noctilio larval gut. (A) Chao index and (B) Shannon index. The Pearson correlation coefficient (R) and the significance level (P-value) are shown on the plots. (C) Spearman correlations of samples with the OTU abundance of bacterial and top seven fungal genera in S. noctilio larval gut. Positive correlations are displayed in red and negative correlations in blue. Color intensity and the size of the circles are proportional to the correlation coefficients. Significant correlations are shown as *P < 0.05, **P < 0.01, and ***P < 0.001. The pink font indicates fungal genera and light blue font indicates bacterial genera.

