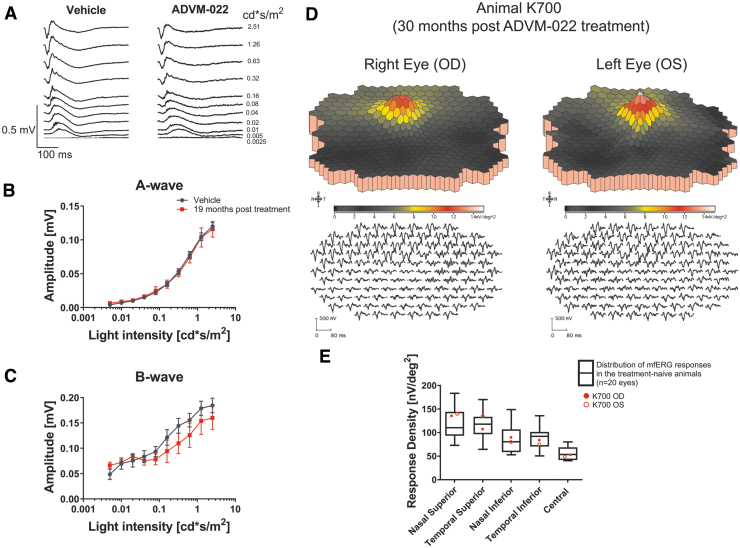
FIG. 9.
ERG analysis of the ADVM-022-treated animals at the late time points reveals normal ERG responses. (A) Scotopic ERG recordings were performed on 2 animals (A055 and A075, n = 4 eyes) treated with ADVM-022 19 months postinjection and compared to vehicle-treated animals (n = 6 eyes). (B) Analysis of scotopic A-wave and (C) B-wave revealed no statistically significant difference between ADVM-022 and vehicle-treated animals (RM-ANOVA A-wave P = 0.95 and B-wave P = 0.48). (D) First-order three-dimensional multifocal ERG topography density at 30 months post-treatment (K700) revealed normal recordings. The stimulus configuration is an array of 103 hexagons scaled with retinal eccentricity. A local response was derived for each of the 103 stimulus elements. First-order ERG recording traces are shown on the lower panels. The mfERG traces are shown equally spaced for clarity. (E) ERG response density at different regions of retina from both eyes for the animal treated with ADVM-022 (K700) at 30 months postdose was plotted against distribution of the ERG responses in treatment-naive, healthy animals (white boxes, n = 20 eyes), and were within limits of responses recorded in the treatment-naive animals.13 Printed with permission from Kiss et al.13 ERG, electroretinography; RM-ANOVA, repeated measures-analysis of variance.

