Figure 2.

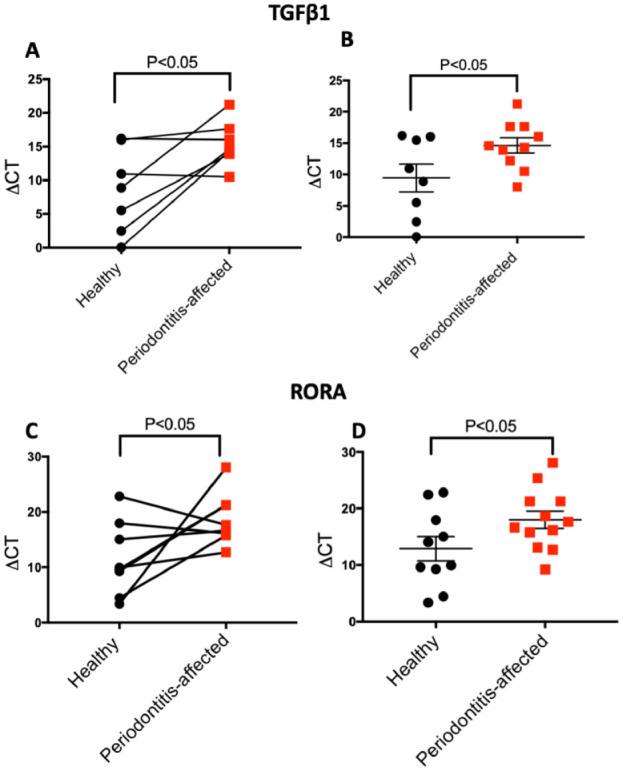
Validation of differential expression of population-specific expression analysis (PSEA)–predicted genes in isolated epithelial cells from gingival tissues. Relative expression levels (ΔCt values) of TGF-β1 assessed through quantitative reverse-transcription polymerase chain reaction (qRT-PCR) in matched (n = 7 pairs connected by horizontal lines; A) and nonmatched analyses (n = 18; B). Relative expression levels of RORA assessed through qRT-PCR in matched (n = 8 pairs by horizontal lines; C) and nonmatched analyses (n = 22; D). Data are presented as mean and standard error of mean; 18s was used as normalizer. P values are derived by 1-tailed t tests, for paired (A, C) and nonpaired observations (B, D). Note that higher ΔCt values indicate lower expression.
