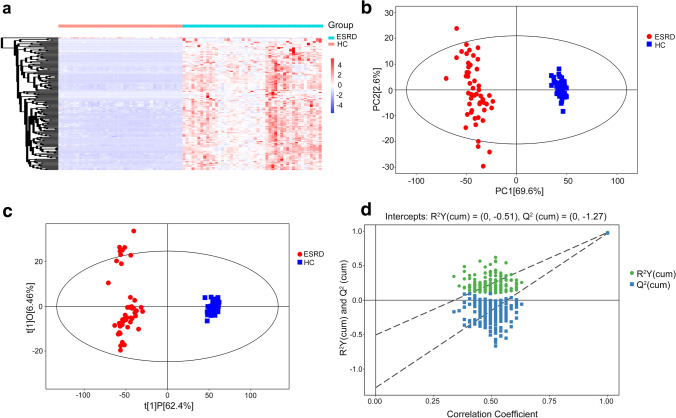
Fig. 1.
Metabolic profile of serum based on LC–MS. a Heatmap of metabolites between the ESRD group and the HC group. b PCA score plot model of serum samples. c OPLS-DA score plot of serum samples. d OPLS-DA permutation plot of serum samples. LC–MS, liquid chromatography/mass spectrometry; ESRD, end-stage renal disease; HC, healthy controls; OPLS-DA, orthogonal partial least-squares discriminant analysis; PCA, principal component analysis

