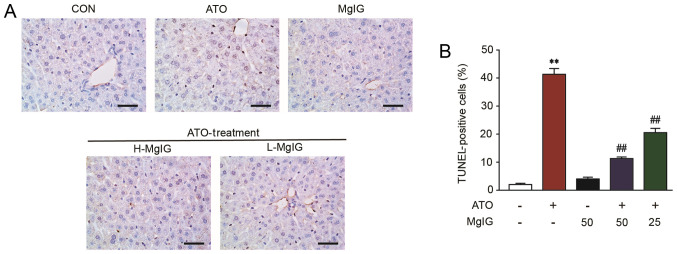
Figure 6.
Effect of MgIG treatment on apoptosis, as detected by TUNEL staining. (A) Representative images of apoptotic cells. (B) Proportion of positive cells. Scale bar, 50 µm; magnification, ×400. Data are presented as the mean ± SEM (n=10). **P<0.01 vs. CON, ##P<0.01 vs. ATO. MgIG, magnesium isoglycyrrhizinate; ATO, arsenic trioxide; CON, control; H-, high; L-, low.

