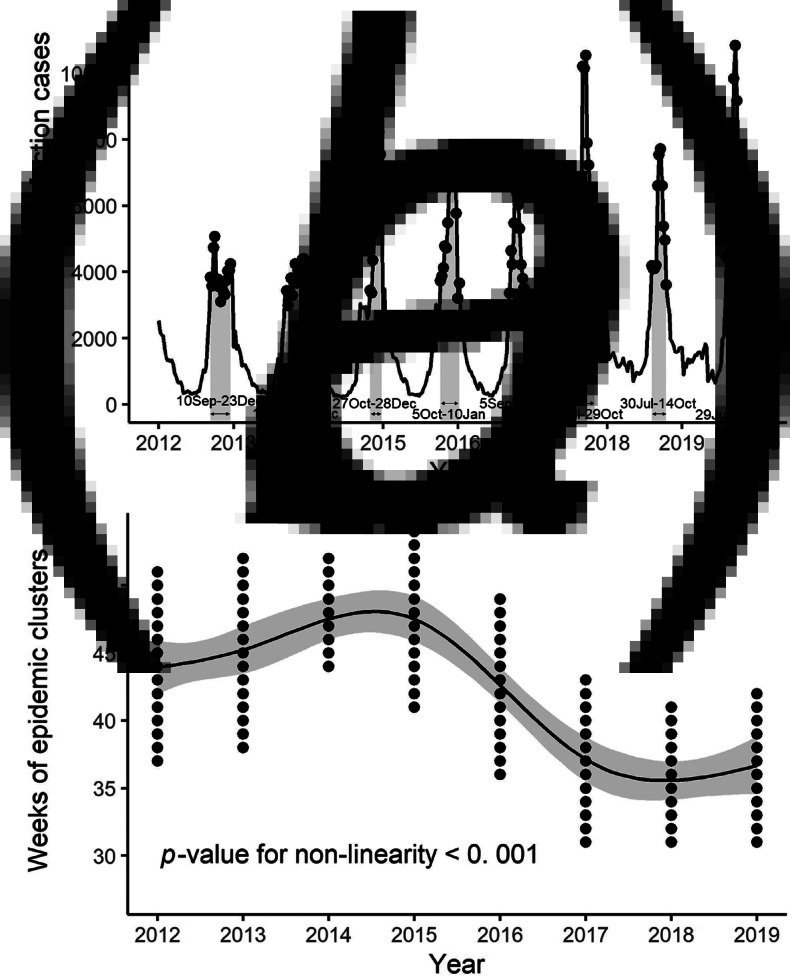
Fig. 1.
Weeks of disease clusters per year detected by the scan statistics, and the predictions of year effect on the weeks of the clusters in 2012–2019, as obtained from the non-linear OLS regression models. (a) The number of weekly reported RSV infection cases from paediatric sentinel sites (solid lines) and the weeks of detected disease clusters (dots and grey areas). The dates in the plot are the cluster-start/end-points. (b) The prediction (solid line) from the non-linear OLS regression model for the weeks of the clusters (dots).

