Figure 3.

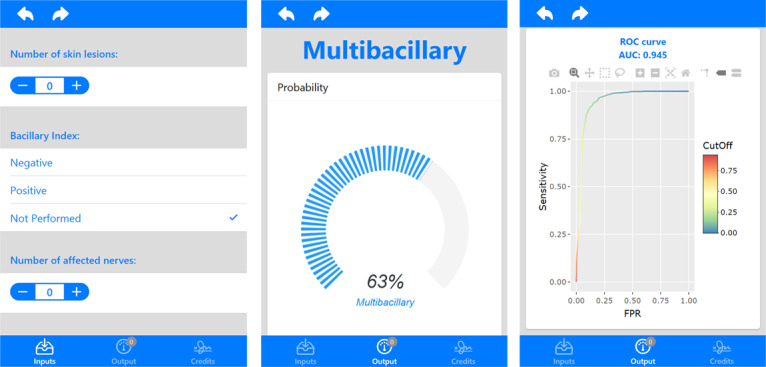
Screenshot representing the R ShinyApp input and output flows. The layout of the app may eventually change to improve user experience. ROC: receiver operating characteristic; AUC: area under the curve; FPR: false positive rate.

Screenshot representing the R ShinyApp input and output flows. The layout of the app may eventually change to improve user experience. ROC: receiver operating characteristic; AUC: area under the curve; FPR: false positive rate.