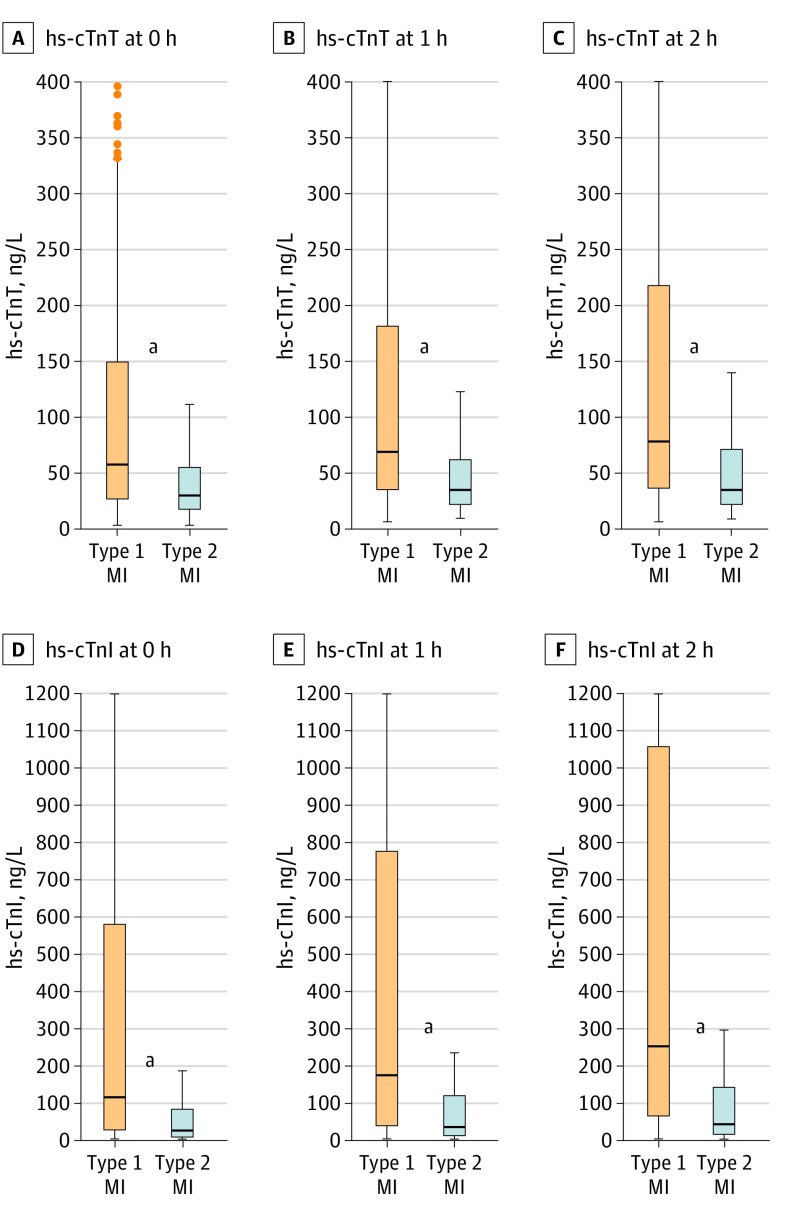
Figure 1. Boxplots for High-Sensitivity Cardiac Troponin T and I Concentrations.
Concentrations of high-sensitivity cardiac troponin T (measured in 851 patients with type 1 myocardial infarction [MI] and 246 patients with type 2 MI) and high-sensitivity cardiac troponin I (848 patients with type 1 MI and 241 patients with type 2 MI) at presentation, and 1 hour and 2 hours after presentation in patients with type 1 MI vs type 2 MI. Boxes represent medians and the interquartile ranges.
aStatistically significant differences between groups (P < .01).

