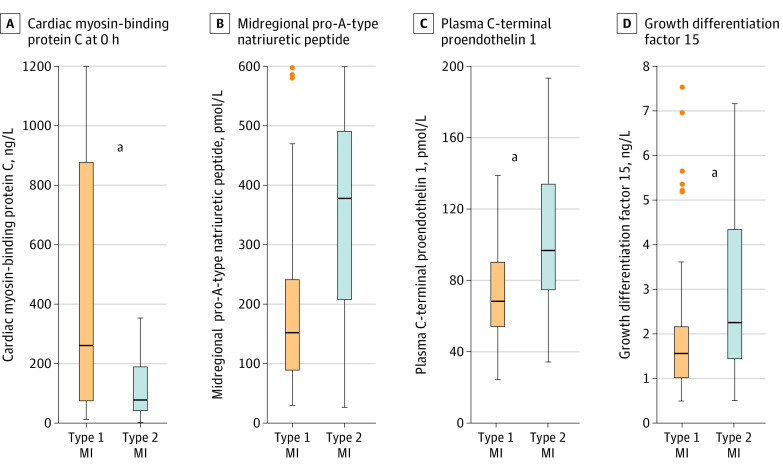
Figure 2. Boxplots of 4 Biomarkers in Patients With Type 1 and Type 2 Myocardial Infarction (MI).
Concentrations of cardiac myosin-binding protein C (measured in 303 patients with type 1 MI and 105 patients with type 2 MI) at baseline (0 hours), midregional pro–A-type natriuretic peptide (measured in 97 patients with type 1 MI and 37 patients with type 2 MI), C-terminal proendothelin 1 measured in 97 patients with type 1 MI and 37 patients with type 2 MI), and growth differentiation factor 15 (measured in 91 patients with type 1 MI and 37 patients with type 2 MI) in patients with type 1 MI vs type 2 MI. Boxes represent medians and the interquartile ranges. The eFigure in Supplement 1 presents data on all biomarkers.
aStatistically significant differences between groups (P < .05).

