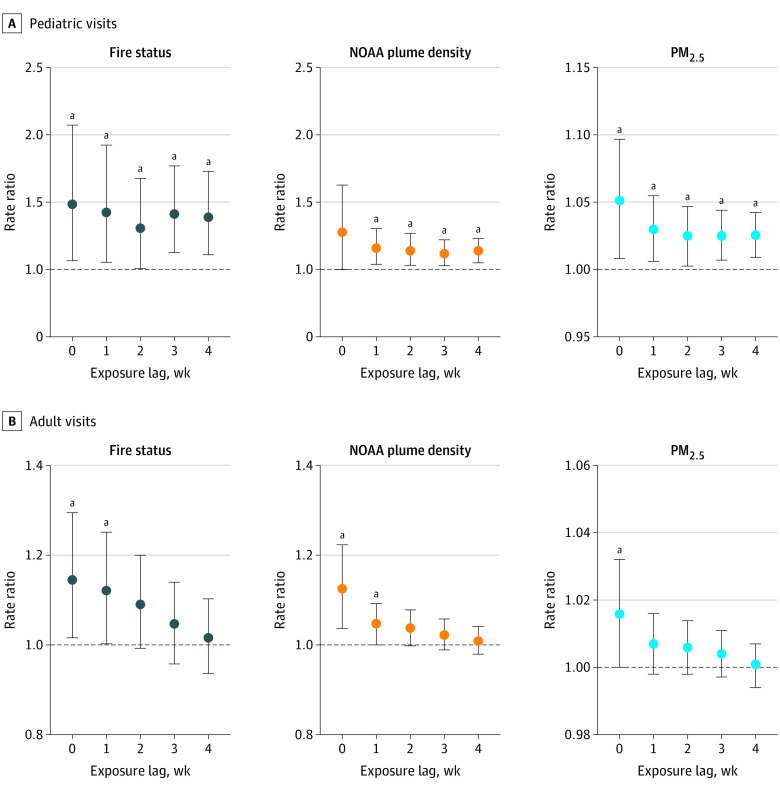
Figure 2. Adjusted Regression Results for Weekly Atopic Dermatitis (AD) Clinic Visits According to Exposure Metric.
Pediatric (A) and adult (B) visits to the dermatology clinics for AD. Circles represent the point estimate adjusted for weekly temperature, humidity, patient age, and total patient volume, error bars represent 95% CIs, and lags represent cumulative exposure to air pollution. The horizontal line at a rate ratio of 1.00 represents the null hypothesis. NOAA indicates National Oceanic and Atmospheric Administration; PM2.5, particulate matter less than 2.5 μm in diameter.
aP < .05.

