FIGURE 1.
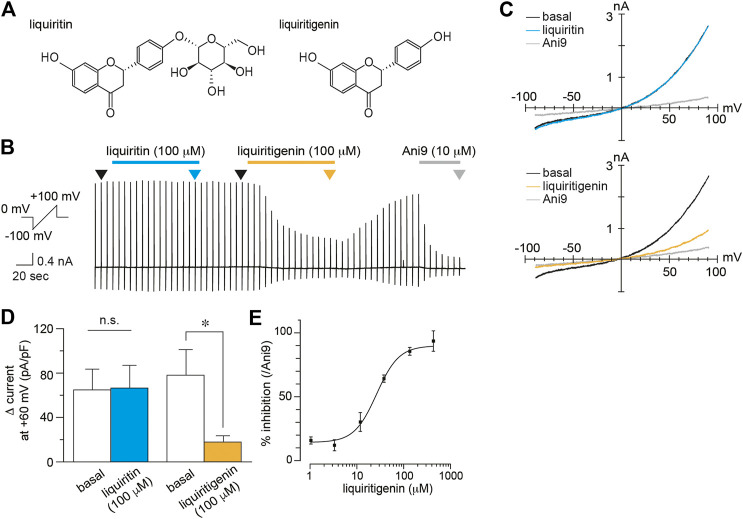
Inhibition of mTMEM16A currents by liquiritigenin (A) Chemical structure of liquiritin (left) and liquiritigenin (right) (B–C) A typical trace (B) and current-voltage curves (C) of whole-cell chloride currents during application of 100 µM liquiritin and 100 µM liquiritigenin to HEK293T cells expressing mTMEM16A. The holding potential was 0 mV, and ramp pulses (−100 to +100 mV, 300 ms) were applied every 5 s. Basal TMEM16A currents were induced by 100 nM intracellular free calcium. Current-voltage curves at the time indicated by black (basal), cyan (liquiritin), yellow (liquiritigenin), and gray (Ani9) arrowheads in (B). (D) Comparison of the Δ current at +60 mV (liquiritin; n = 7 cells, liquiritigenin; n = 8 cells). Data are shown as the mean ± SEM; *p < 0.05, n. s., not significant, Wilcoxon matched-pairs signed rank test (E) Dose-response curve for liquiritigenin-induced inhibition of mTMEM16A currents at +60 mV (n = 5–6 cells). The IC50 was 21.32 µM.

