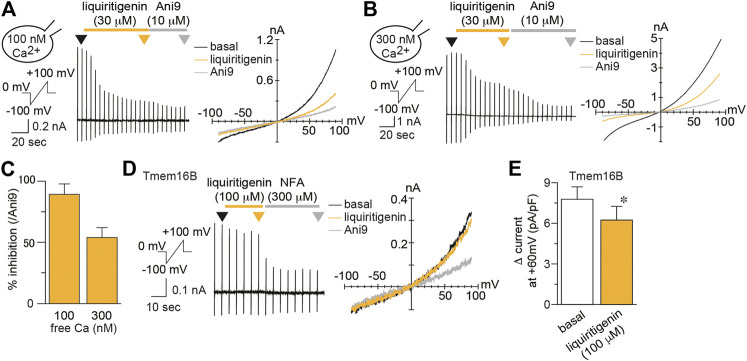
FIGURE 2.
Characterization of liquiritigenin (A–B) Typical traces (left) and current-voltage curves (right) of mTMEM16A currents induced by 100 nM (A) or 300 nM (B) intracellular free calcium during application of 30 µM liquiritigenin to HEK293T cells expressing mTMEM16A. The holding potential was 0 mV, and ramp pulses (−100 to +100 mV, 300 ms) were applied every 5 s. Typical current-voltage curves at the time indicated by black (basal), yellow (liquiritigenin), and gray (Ani9) arrowheads (C) The percentage of inhibition caused by 30 µM liquiritigenin applied with 100 and 300 nM intracellular free calcium concentrations (n = 5–6 cells) (D) A typical trace (left) and current-voltage curves (right) of whole-cell chloride currents during application of 100 µM liquiritigenin in HEK293T cells expressing mTMEM16B. The holding potential was 0 mV, and ramp pulses (−100 to +100 mV, 300 ms) were applied every 5 s. Basal mTMEM16B currents were induced by 300 nM intracellular free calcium. Typical current-voltage curves at the time indicated by black (basal), yellow (liquiritigenin), and gray (niflumic acid, NFA) arrowheads (E) Comparison of the Δ currents in HEK293T cells expressing mTMEM16B at +60 mV (n = 5 cells). Data are shown as the mean ± SEM; *p < 0.05, Wilcoxon matched-pairs signed rank test.

