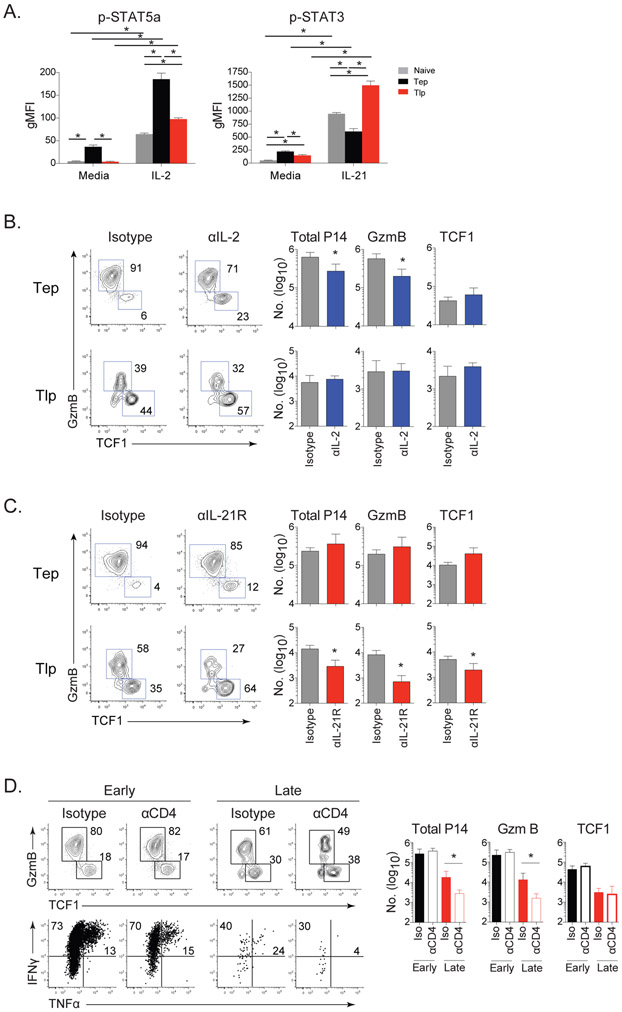
Figure 6. CD4+ T cell help and differential IL-2 and IL-21 usage drive differentiation of TCF1+ into GzmB+ effector antiviral CD8+ T cell subsets at distinct times after infection.
(A) STAT5a and STAT3 phosphorylation by P14 Tn, (gray), Tep (black) or Tlp (red) cells isolated from mice 60hrs after priming and then cultured without stimulation (media) or following IL-2 or IL-21 stimulation for 30 minutes.
(B & C) Naïve mice immediately infected with Cl13 or mice infected 21 days prior with Cl13 received P14 T cells and were treated with (B) isotype (gray) or anti-IL-2 (blue); (C) isotype (gray) or anti-IL-21R (red) antibodies. Flow plots depict the proportion and bar graphs the number of total, GzmB+ and TCF1+ virus-specific CD8+ Tep and Tlp P14 cells 8 days after priming.
(D) Mice were CD4+ depleted or isotype treated (undepleted) prior to Cl13 infection. (Top) Flow plots depict the proportion and bar graphs show the numbers of total, GzmB+ and TCF1+ subsets of Tep or Tlp cells 8 days after priming. (Bottom) Proportion of IFNγ and TNFα producing Tep or Tlp cells upon peptide restimulation 8 days after priming.
Data represent 2 independent experiments with 4-5 mice per group. Error bars indicate SD. Significance was determined by t-test. *, p<0.05.
See also Figure S5.

