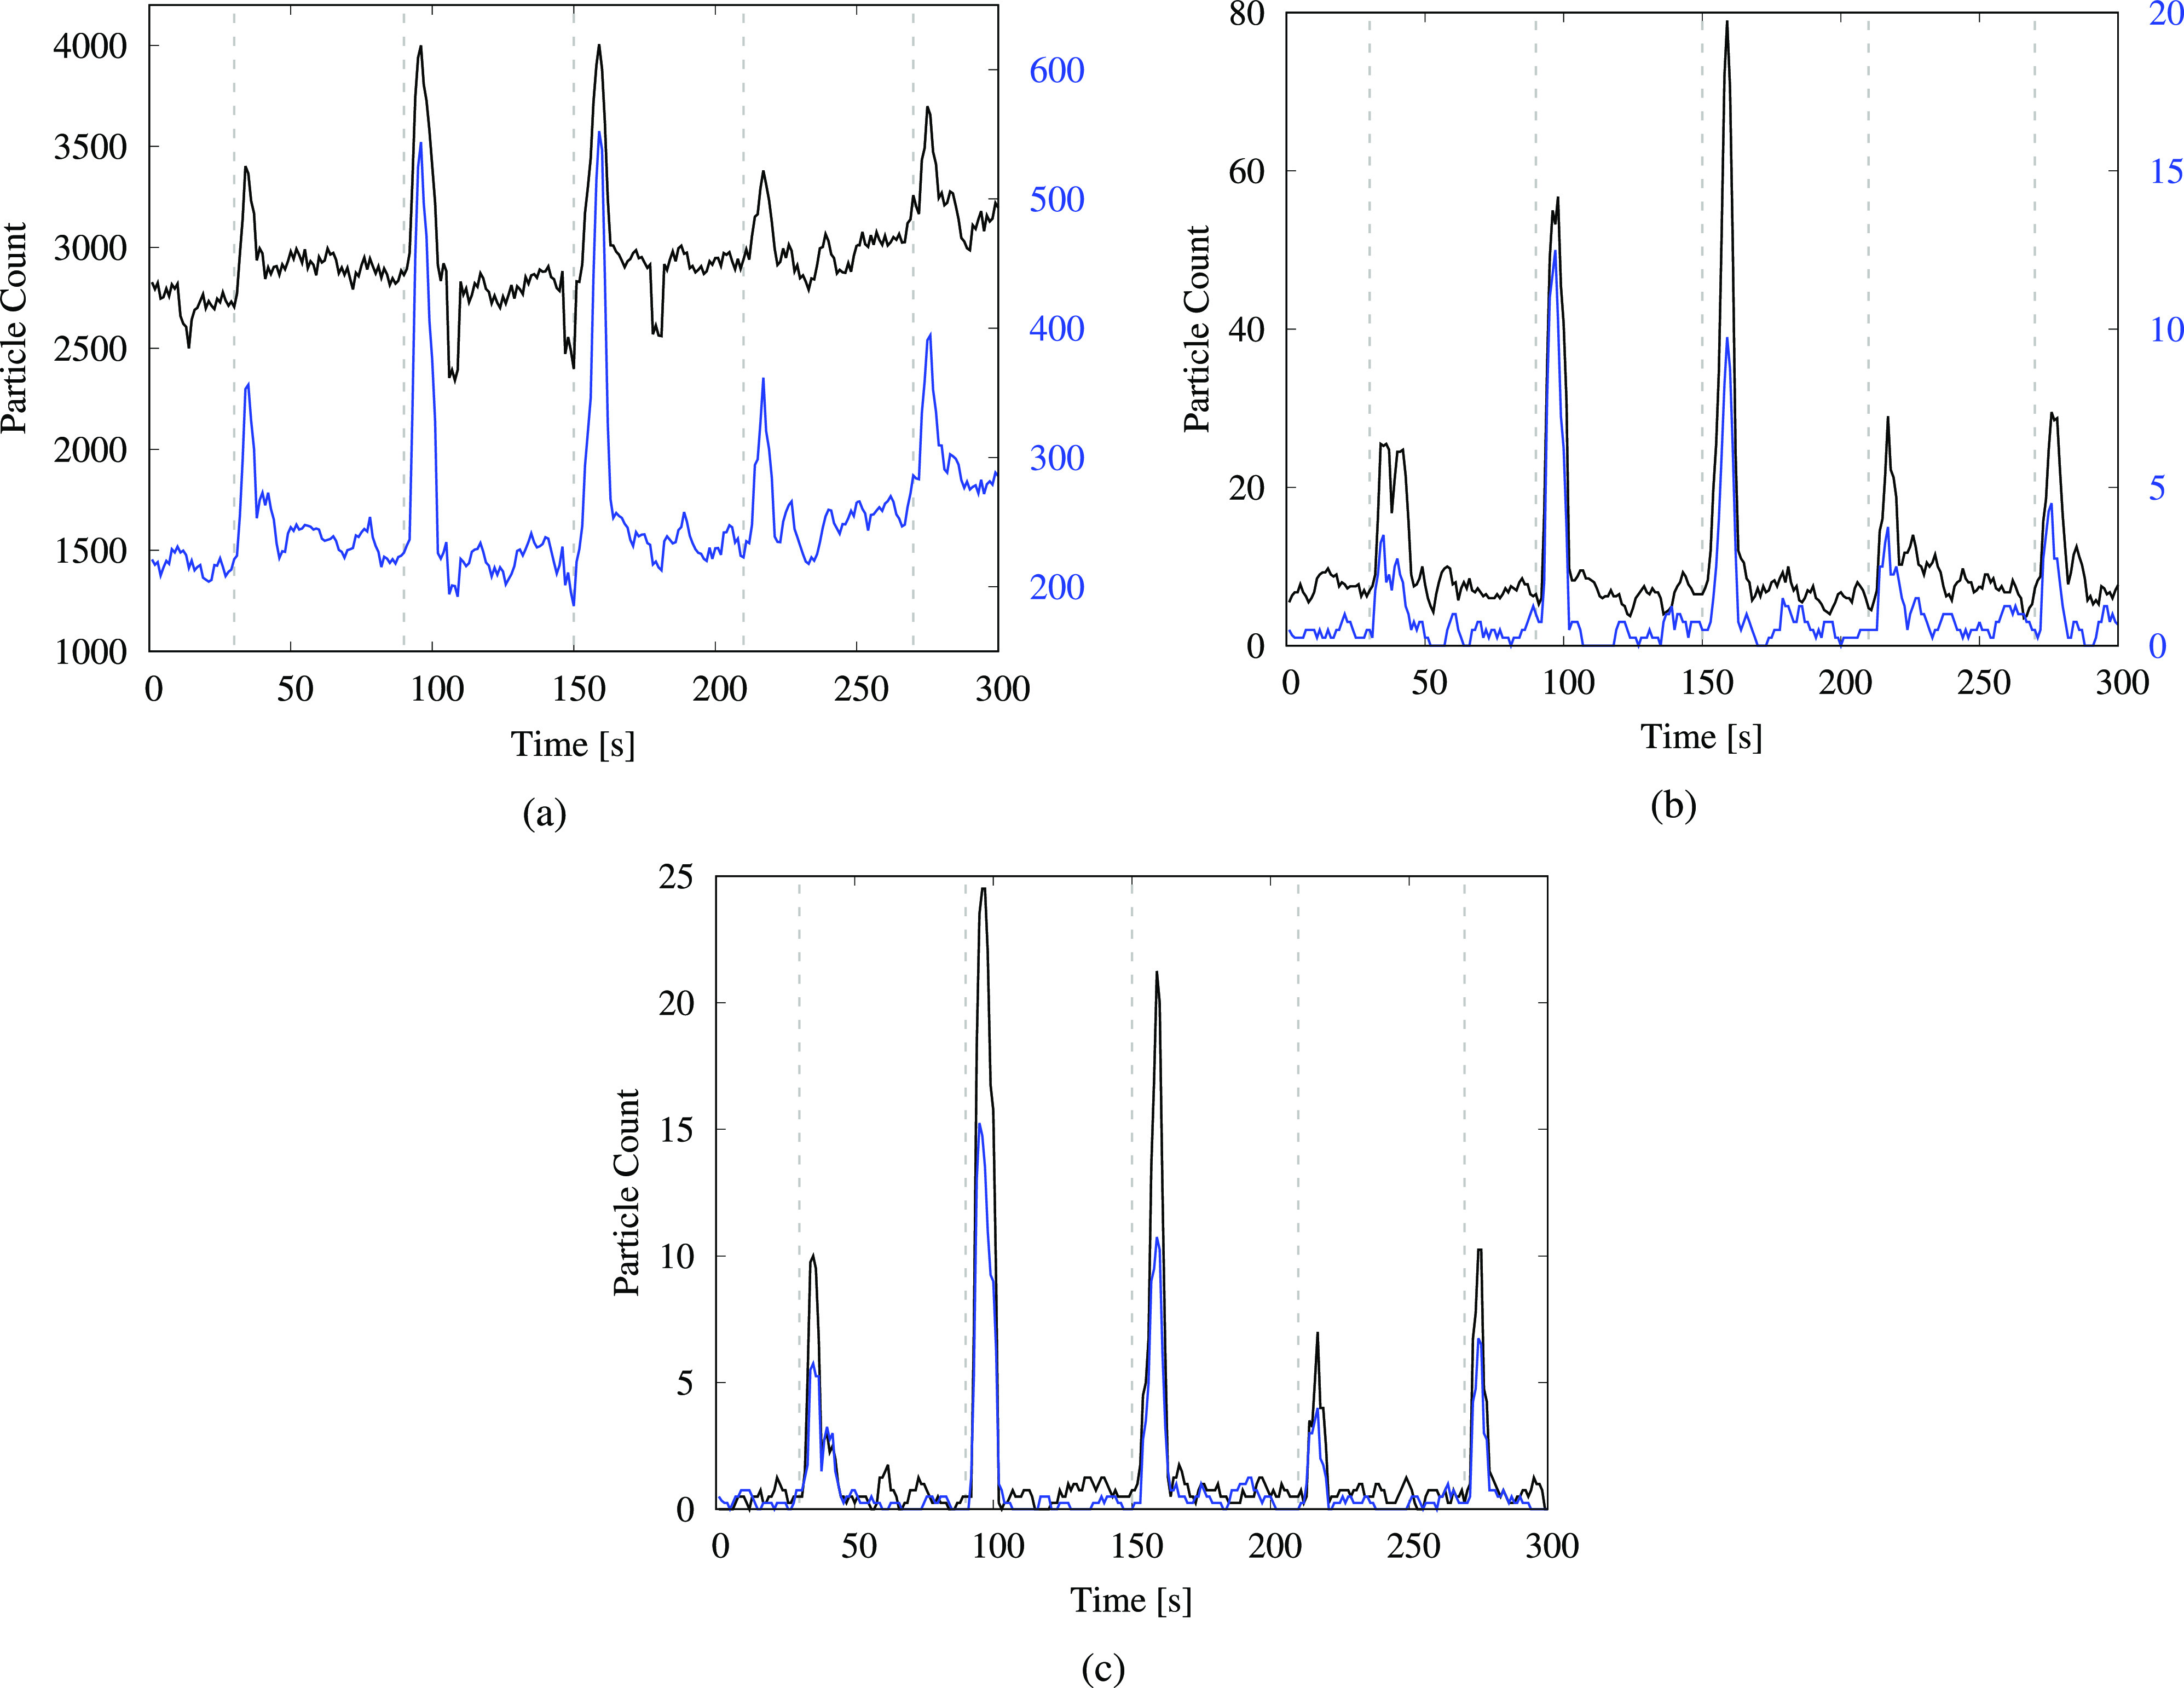
FIG. 4.

Particle count from the urinal-flushing test, measured at a height of 0.53 m (1 ft 9 in.). The time-series plots are shown for particles in various size ranges: (a) (0.3–0.5) μm—black and (0.5–1) μm—blue; (b) (1–3) μm—black and (3–5) μm—blue; and (c) (5–10) μm—black and (10–25) μm—blue. The black curves in (a) and (b) correspond to the left vertical axes, whereas the blue curves correspond to the right vertical axes. The dashed gray lines indicate the instances when the flush was activated using a proximity sensor.
