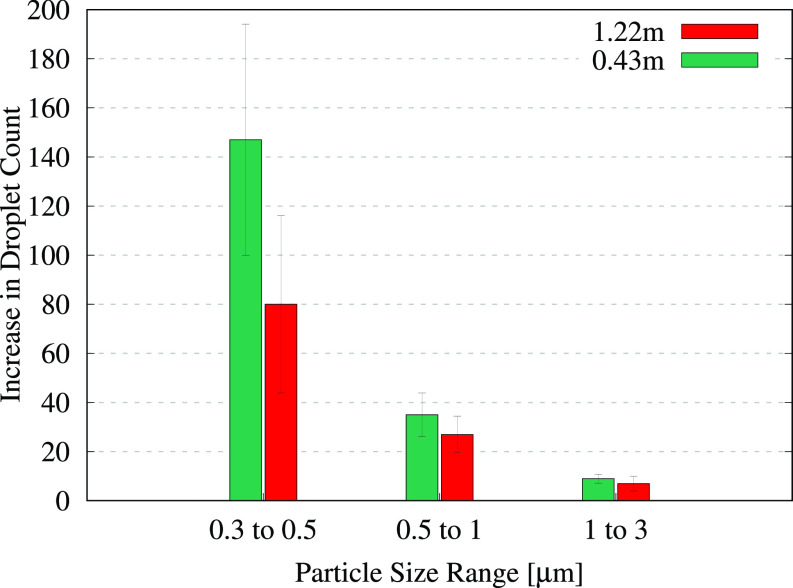
FIG. 6.
Average increase in the number of droplets measured per second from flushing the covered toilet. The error bars indicate the standard deviation of the measured increase from multiple flushes. Each bar cluster corresponds to particles in a given size range and indicates how the droplet count varies with the measurement height. The corresponding values are provided in Table III.

