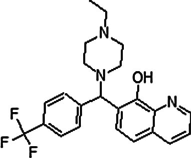
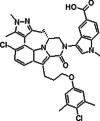
Table 2.
MCL-1 targeted anti-tumor drugs in the preclinical stage
| Compound | Efficacy towards malignant cells | In vitro potency | drug discovery method | References | |
|---|---|---|---|---|---|
| MIM1 |

|
MCL-1 dependent leukemia cells | IC50: < 4.2 μM | HTS (2013) | [81] |
| UMI-59/77 |

|
BxPC-3 xenograft model | Ki: 490 nM | HTS (2014) | [84] |
| Complex 39 |

|
NCI-H460 cell line and xenograft model | IC50: 12–18 μM | [102] | |
| Complex 14 |

|
NCI-H460 xenograft model | Ki: 1.4 nM | [101] | |
| Pyridoclax/Compound12 |

|
Ovarian cancer cell line | – | (2014/2018) | [77, 78] |
| ML311/EU-5346 |

|
Active MCL-1 cell line | IC50: 0.31 μM | HTS (2013) | [82, 83] |
| A-1210477 |

|
MCL-1-dependent cell lines | Ki: 4–5 nM | HTS (2015) | [62] |
| BIM SAHBA | NA | DLBCL cell lines | EC50: 2–18 μM | [79] | |
| MS1 | PREIWMTQGLRRLGDEINAYYAR | MCL-1 dependent cell lines | Kd:1.9 ± 1.0 nM | [80] | |
| VU661013 |

|
AML, MM, triple negative breast cancer cell lines | Ki: 97 ± 30 pM | Structure-based design (2018) | [90, 124] |
| Wang.Compound12 |

|
NCI-H345 cell line | IC50: 2.2 μM | Fragment-based approach (2016) | [107] |
| Compound8 |

|
A2780, MCF-7, SMMC-7721 and DLD1 cell lines | IC50: 38–47 μM | Virtual screening (2017) | [108] |
| Compound24 |

|
Lymphoma cell lines | Ki: 100 nM | HTS and virtual screening (2020) | [109] |
| Compound M08 |

|
Hematological and solid cancer cell lines | Ki: 0.53 ± 0.07 μM | Structure-based virtual screening (2020) | [110] |
| Compound5 |

|
L-363, LP-1, NCI-H929 and MOLP-8 | IC50: 3.4 nM | [92] | |
| C3 |

|
HeLa, K562, NCI-H23 cell line | IC50: 0.78 ± 0.12 μM | (2019) | [105] |
| dMCL1-2 |

|
MM cell line OPM2 | Kd: 30 nM | (2019) | [104] |
| MI-223 |

|
H1299 cell | Kd: 193 ± 4.3 nM | Virtual screening (2018) | [91] |
| APG-3526 | NA | MM cell line | IC50: 7 nM | (2020) | [106] |
EC50 Half-maximal concentration of drug, IC50 Concentration inhibitory to 50% of cells, Ki Inhibition constant, Kd Dissociation constant
