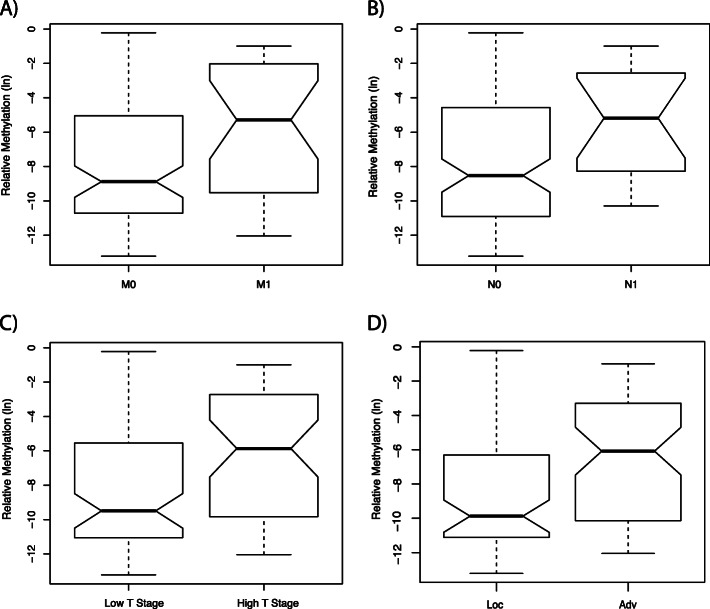
Fig. 2.
Box plot illustration of TACSTD2 methylation and its association with clinicopathological characteristics. The box plot illustrates the median, the estimated confidence intervals, and the 25% quartiles in both groups. Presentation of the natural logarithm of relative methylation of metastasis negative (M0) versus metastasis positive (M1) tumors (a), lymph node negative (N0) versus lymph node positive (N1) tumors (b), low (defined as T1 and T2) versus high (defined as T3 and T4) tumor stage (c) and localized (Loc. defined as pT ≤ 2, N0, M0) versus advanced disease (Adv. defined as pT ≥ 3 and/or N1, M1) (d). Statistical analyses showed significant higher methylation levels in metastasis positive tumors, high tumor stage and advanced disease (Table 2)

