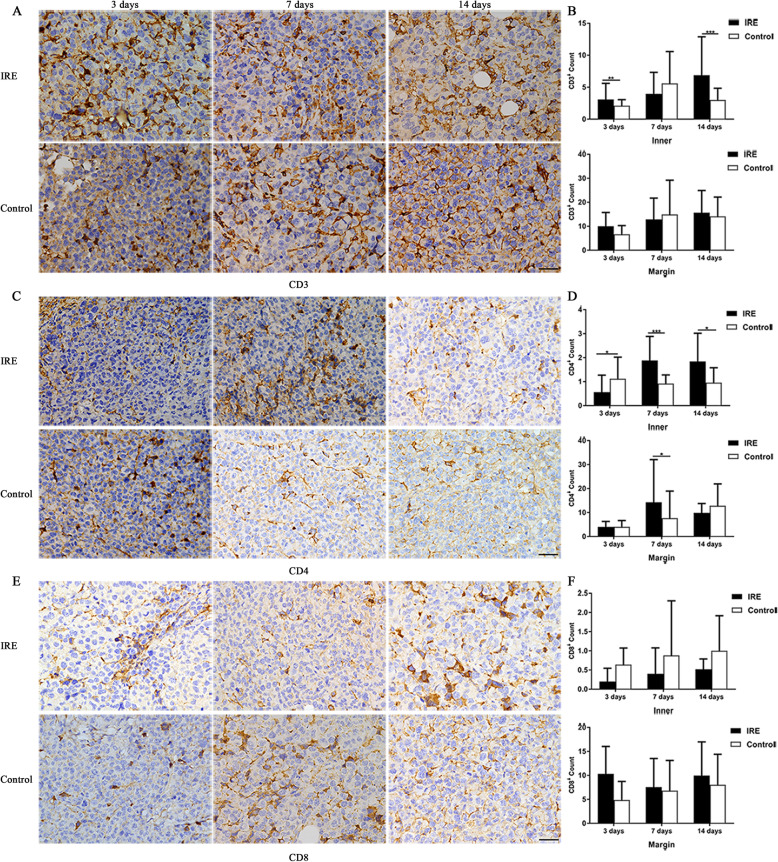
Fig. 6.
Tumor-infiltrating T lymphocytes counts of mice in the IRE and control groups, 3, 7, and 14 days post-IRE, analyzed with immunohistochemistry. a, c, e Representative micrographs showing cells stained with CD3, CD4, and CD8. Scale bars = 20 μm. b, d, f The numbers of CD3+ T cells (b), CD4+ T cells (d), and CD8+ T cells (f) that infiltrated into the inner regions and at the margin of tumors. *p < 0.05, **p < 0.01, ***p < 0.001

