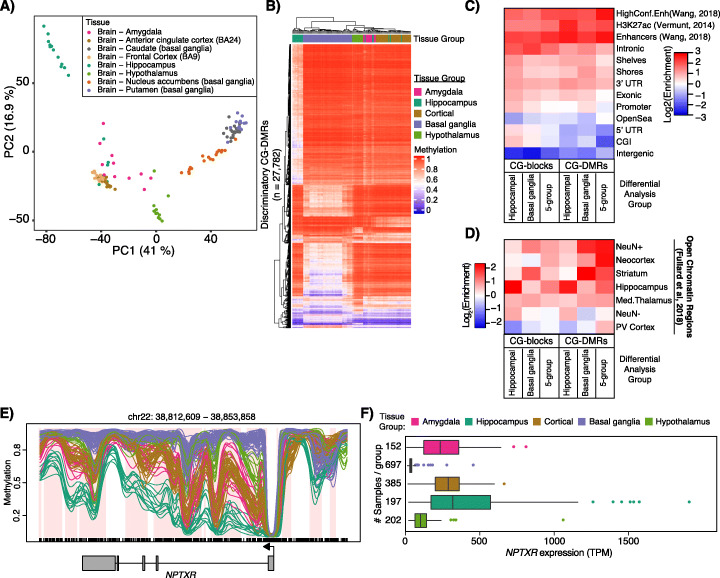
Fig. 1.
Identification of CG-DMRs among neurons of functionally distinct brain regions. DNA methylation was assessed in neuronal nuclei isolated from 8 brain regions as indicated from 12 to 24 individuals. a Principal component analysis of distances derived from average autosomal CpG methylation in 1-kb bins. b Hierarchical clustering of samples based on the average methylation per sample in the most discriminatory CG-DMRs (see the “Methods” section). c Heatmap representing log2 enrichment of CpGs within CG-DMRs and blocks identified in each CG-DMR analysis compared to the rest of the genome for genomic features. Gene models from GENCODEv26 (promoters, intronic, exonic, 5′UTR, 3′UTR, intergenic), CpG islands (CGIs) and related features from UCSC (shores, shelves, OpenSea), putative enhancer regions (enhancers and high confidence enhancers from PsychENCODE [18] and H3K27ac [19]). 5-group = CG-DMRs or blocks between all 5 tissue groups. d As in c, showing enrichment in regions of open chromatin in NeuN− and NeuN+ nuclei and NeuN+ nuclei isolated from the indicated brain regions (PV cortex, primary visual cortex; Med. thalamus, mediodorsal thalamus) from [10]. e Example CG-DMRs covering the NPTXR gene showing average methylation values for NeuN+ nuclei from each tissue group color coded as in b. Regions of differential methylation are shaded in pink. f Expression of NPTXR from sample matched bulk brain tissues from GTEx v8 data release

