Fig. 4.
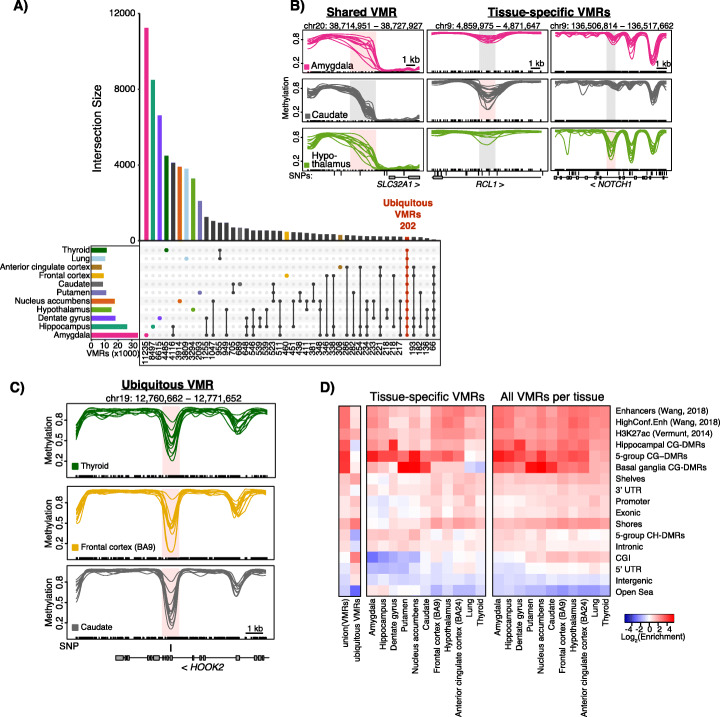
Methylation variability across brain and non-brain tissues. a VMRs shared among two non-brain tissues and neuronal nuclei from distinct brain regions. The number of VMRs in each intersection is listed at the bottom of the plot. b Examples of shared and tissue-specific VMRs in the amygdala (pink), caudate (gray), and hypothalamus (green). VMRs are shaded pink in the tissue they were identified in and gray in tissues where they were not considered a VMR; SNPs are indicated when present. c Example of a ubiquitous VMR shared across brain and non-brain tissues as indicated. d Heatmap representing log2 enrichment of the union of all VMRs identified, ubiquitous VMRs, tissue-specific VMRs, and all VMRs identified in each tissue as indicated compared to the rest of the genome for genomic features. Gene models from GENCODEv26 (promoters, intronic, exonic, 5′UTR, 3′UTR, intergenic), CpG islands (CGIs) and related features from UCSC (shores, shelves, OpenSea), putative enhancer regions (enhancers and high confidence enhancers from PsychENCODE [18] and H3K27ac [19]). 5-group CG-DMRs = CG-DMRs identified among all 5 tissue groups

