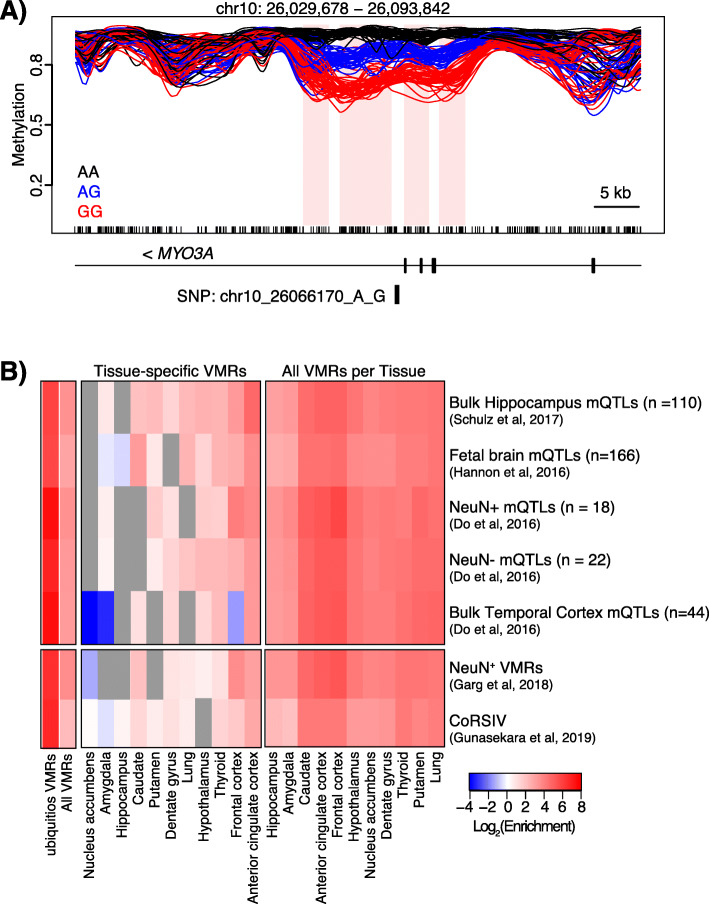
Fig. 6.
Genetic contributions to methylation variability. a Example of a SNP associated with altered methylation within MYO3A showing average methylation values for each genotype (indicated) for all tissues. The VMRs associated with this SNP are shaded pink and the SNP is indicated. b Heatmap representing log2 enrichment of CpGs within VMRs and tissue-specific VMRs compared to the rest of the genome for previously published mQTL datasets [6, 51, 52], neuronal VMRs [35], and correlated regions of systemic interindividual variations (CoRSIVs) [36]. Only significant enrichments/depletions are shown; non-significant combinations are shaded gray

