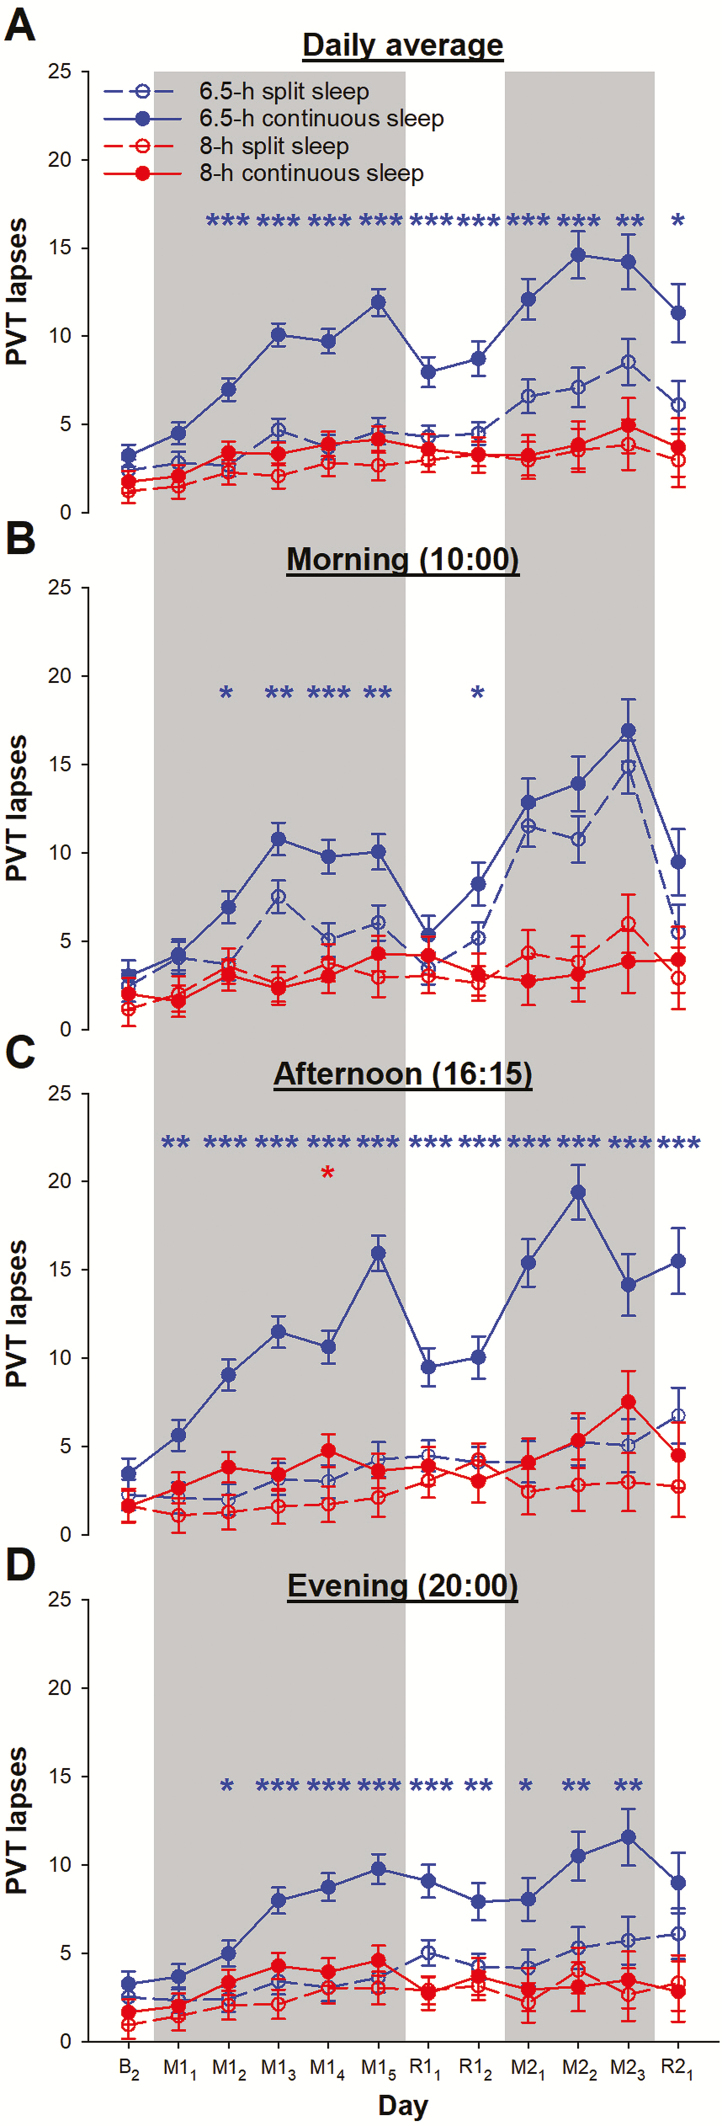
Figure 4.
Vigilance performance during a split or continuous sleep schedule when total TIB was below or within the recommended range. The numbers of lapses in the PVT are shown (A) averaged across the three tests each day, and separately for tests taken in the (B) morning, (C) afternoon, and (D) evening. PVT results are plotted after the last baseline night (day B2), during the first cycle of sleep opportunity manipulation (days M11–M15; gray shading) and after recovery nights (R11 and R12), to the second cycle of sleep manipulation (days M21–M23 in gray shading) and recovery sleep (R21). Observations for the 8-h split sleep group are shown in red open circles and dotted lines, while those for the 8-h continuous sleep group are illustrated in red filled circles and solid lines. For comparison, performance in a 6.5-h split sleep group (blue open circles and dotted lines) and a 6.5-h continuous sleep group (blue filled circles and solid lines) from a previous study [13] are also presented. The least square means and standard errors estimated with general linear mixed models are plotted. ***p < 0.001, **p < 0.01, and *p < 0.05 for significant contrasts between the split and the continuous sleep groups (red for the two 8-h sleep groups and blue for the two 6.5-h sleep groups).

