Figure 10.
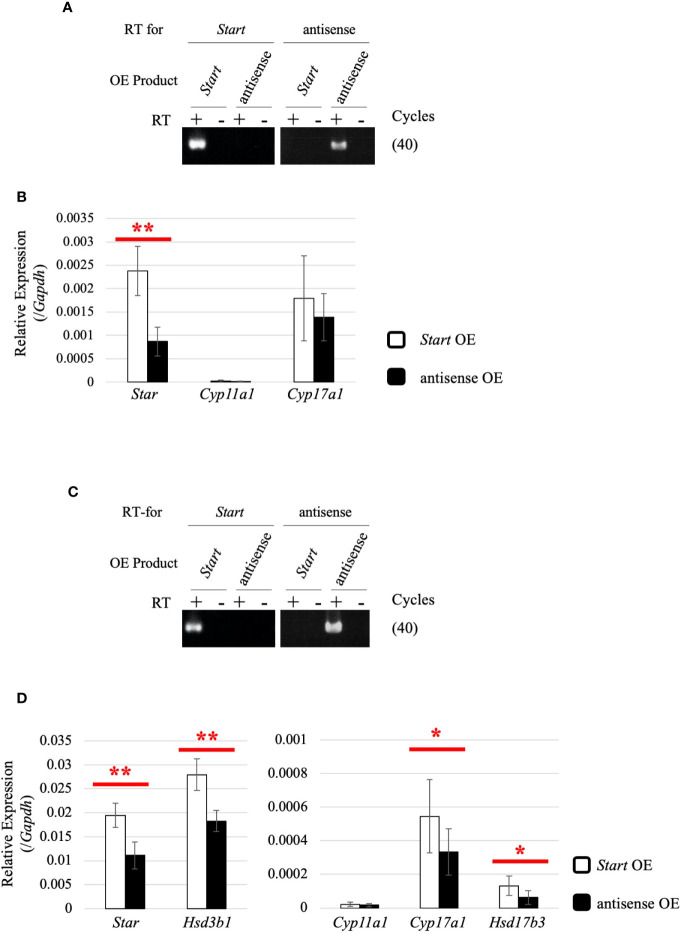
Effect of Start overexpression in Leydig cell lines. (A) Start overexpression in TM3 cells by strand-specific RT-PCR. Total RNAs were purified from TM3 cells that had been transfected with vectors for overexpression of the sense or antisense strand of Start. RT-PCR was performed using reverse and forward primers of “Start full length” ( Table 1 ) for specific reverse transcription of Start and its antisense transcript, respectively. ‘RT for’ shows the transcript to be detected by each RT-PCR, and ‘OE Product’ shows the transcript that was overexpressed in the cell. The cycle number of PCR is shown in parenthesis. (B) Expression of steroidogenic genes in TM3 cells overexpressing Start. Total RNAs purified in (A) were used for qRT-PCR using the oligo(dT) primer for reverse transcription. The Gapdh gene was used as an internal control to normalize the expression level of each gene. Data are presented as means ± S.D. from three independent experiments (three biological replicates), and statistical significance was analyzed by Welch’s t-test. **P < 0.01. (C) Start overexpression in MA-10 cells by strand-specific RT-PCR. Start overexpression was performed in MA-10 cells. Strand-specific RT-PCR was performed and the results are indicated as above. (D) Expression of steroidogenic genes in MA-10 cells overexpressing Start. qRT-PCR was performed as in (B) and the results are shown as above. Data are presented as means ± S.D. from four independent experiments (four biological replicates), and statistical significance was analyzed by Student’s t-test. *P < 0.05, **P < 0.01.

