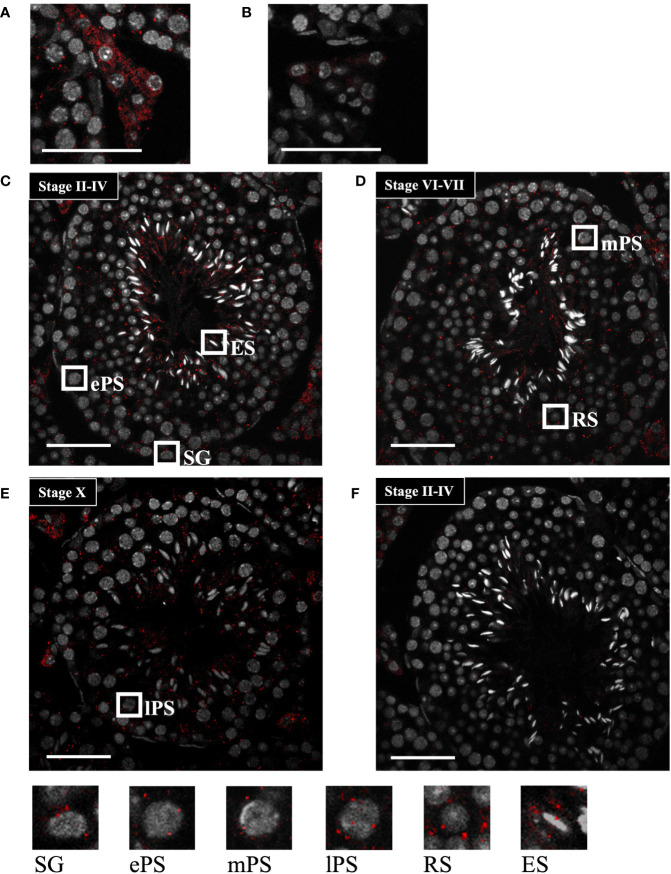
Figure 4.
Start localization determined by in situ hybridization using the tyramide signal amplification system. (A, B) Representative images of Start localization in interstitial Leydig cells stained with the antisense probe (A) and sense probe (B). Staining with the sense probe was performed as a negative control. (C–E) Representative images of seminiferous tubules at seminiferous epithelial stages II-IV (C), VI-VII (D), and X (E) stained with the antisense probe. The squares indicate the cells enlarged below. As specified in (C–E), the squares emphasize a spermatogonium (SG), primary spermatocytes at the early, mid, and late pachytene stages (ePS, mPS, and lPS, respectively), round spermatid (RS), and elongating spermatid (ES). (F) An image of seminiferous tubules at stage II-VI stained with the sense probe as a negative control. In all images, red dots represent Start signals, and nuclei were co-stained with Hoechst 33258 (grey). The experiment was repeated twice with different testes, and similar results were obtained. Scale bars, 50 µm.

