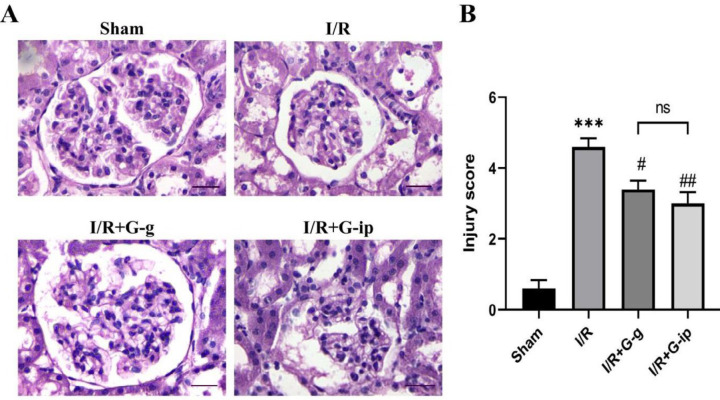
Figure 1.
Histopathological examination of I/R-induced renal injury. H & E staining (400 ×) of kidney sections in the sham group, I/R, IR + G-g, and IR + G-ip animals are depicted (A). ***P<0.001 compared with the sham group; # P<0.05 and ##P<0.01 compared with the I/R induced rats (B). H&E: hematoxylin and eosin; I/R: ischemia-reperfusion, ns: non-significant (Scale bar=25 μm)

