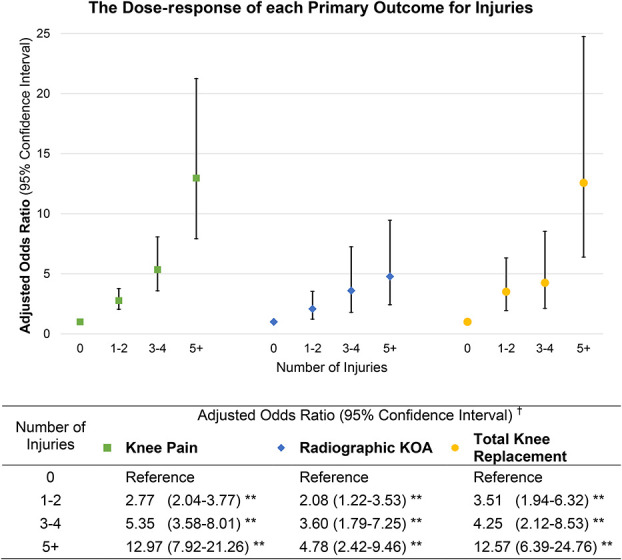
Figure 2.

Dose response (OR) for primary outcomes for number of injuries. This figure presents the aOR for the risk of having outcomes of KOA, namely KP (green square), RKOA (blue diamond), and TKR (yellow circle), with increasing number of injuries. Data for the aOR and 95% CIs are included below the graph for reference. †OR adjusted for age and BMI; **P < 0.01.
