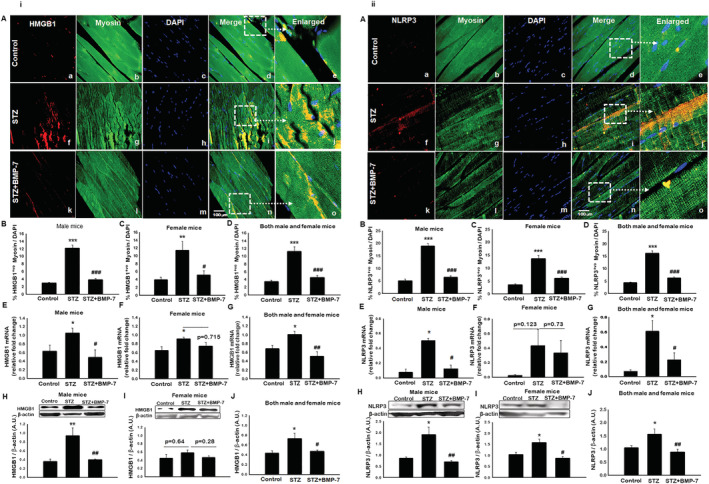
Figure 2.

(i) Bone morphogenetic protein‐7 (BMP‐7) treatment inhibits pyroptosis initiator high‐mobility group box 1 (HMGB1). Hyperglycaemia‐induced HMGB1 can initiate the inflammasome activation and subsequent pyroptotic cascade results in pyroptotic cell death. Representative photomicrographs of muscle sections stained with myosin and inflammasome markers. Individual boxes in panel (A) show HMGB1+ve cells shown in red (a, f, k), muscle cells in green (b, g, l), DAPI in blue (c, h, m), and merged images (d, i, n). Scale bar = 100 μm. White dotted boxes and arrows indicate enlarged section of merged images (e, j, o). Quantitative analysis‐derived in bar graphs of HMGB1+ve muscle cells quantified over total DAPI [B: Male mice (n = 8); C: Female mice (n = 7–8); D: Both male and female mice (n = 16)]. Relative fold change in gene expression of HMGB1 [E: Male mice (n = 5–7); F: Female mice (n = 5); G: Both male and female mice (n = 11–12)]. Representative blot and densitometric analysis of HMGB1 [H: Male mice (n = 7); I: Female mice (n = 4–5); J: Both male and female mice (n = 13–14)]. One‐way ANOVA and Tukey tests were performed to assess statistical significance. *P < 0.05, **P < 0.01, and ***P < 0.001 vs. control, #P < 0.05, ##P < 0.01, and ###P < 0.01 vs. STZ. (ii) BMP‐7 treatment decreases nucleotide‐binding oligomerization domain, leucine‐rich repeat and pyrin domain containing protein 3 (NLRP3) inflammasome formation in diabetes. HMGB1‐toll‐like receptor‐4 (TLR4) signalling initiates the NLRP3 inflammasome activation. Representative photomicrographs of muscle sections stained with myosin and inflammasome markers NLRP3. Individual boxes in panel (A) shows NLRP3+ve cells in red (a, f, k), muscle cells in green (b, g, l), DAPI in blue (c, h, m), and merged images (d, i, n). Scale bar = 100 μm. White dotted boxes and arrows indicate enlarged section of merged images (e, j, o). Quantitative analysis‐derived in bar graphs of NLRP3+ve muscle cells quantified over total DAPI [B: Male mice (n = 7–8); C: Female mice (n = 8); D: Both male and female mice (n = 15–16)]. Relative fold change in gene expression of [E: Male mice (n = 5–7); F: Female mice (n = 4–6); G: Both male and female mice (n = 9–11)]. Representative blot and densitometric analysis of NLRP3 [H: Male mice (n = 6–7); I: Female mice (n = 5–6); J: Both male and female mice (n = 14–15)]. One‐way ANOVA and Tukey tests were performed to assess statistical significance. *P < 0.05 and ***P < 0.001 vs. control, #P < 0.05, ##P < 0.01, ###P < 0.001 vs. streptozotocin (STZ).
