Figure 1.

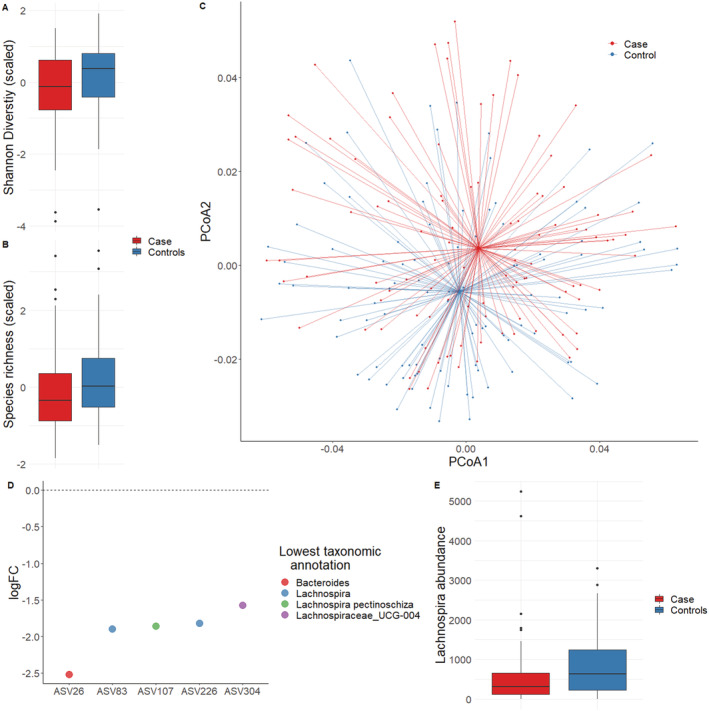
Microbiota differences observed between cases (Simplified Nutritional Appetite Questionnaire < 14) and controls (Simplified Nutritional Appetite Questionnaire > 14). (A) Shannon diversity (scaled) and (B) microbiota richness (scaled) between cases and controls. (C) First two PCoAs of weighted UniFrac distances, with case and control group centroids. (D) False discovery rate‐significant results of paired‐tests of differences in ASV abundance between cases and controls and (E) difference in the Lachnospira genus, observed as false discovery rate‐significant in paired‐tests of differences in genus abundance.
