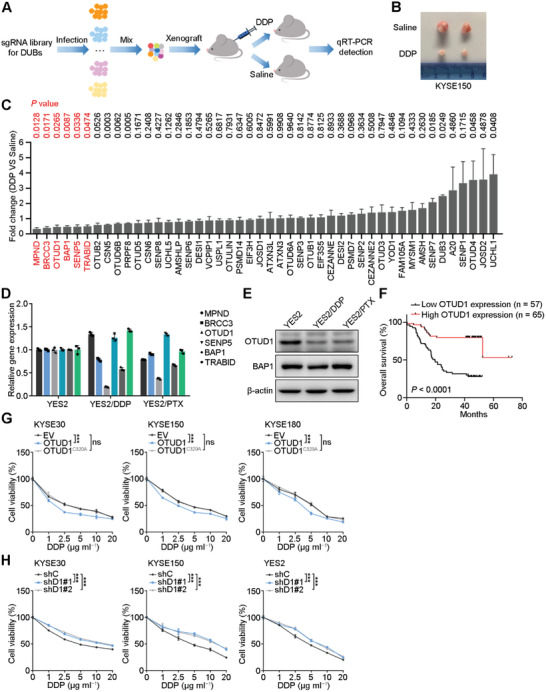
Figure 1.

Low OTUD1 expression correlates with chemoresistance and poor prognosis. A) Schematic showing the in vivo screening strategy for proapoptotic DUBs. B) Representative image of xenografts treated with saline or DDP. C) qRT‐PCR analysis for fold change of gene expression of 46 DUBs between DDP‐ and saline‐treated xenografts. The data are the means ± s.e.m.; n = 4. Two‐tailed t tests. D,E) qRT‐PCR and Western blotting analyses for gene expression in chemoresistant and parental YES2 cell lines. The data are the means ± s.d.; n = 3. F) Correlations between OTUD1 expression and overall survival in ESCC patients. n = 122. Kaplan‐Meier survival plots are shown. G) Relative viability of ESCC cells expressing empty vector (EV), OTUD1 or OTUD1C320A. The data are the means ± s.d.; n = 5. Two‐way ANOVA test, ***p < 0.001, ns: not significant. H) Relative viability of ESCC cells expressing OTUD1‐targeting (shD1#1, shD1#2) or nontargeting (shC) shRNAs. The data are the means ± s.d.; n = 5. Two‐way ANOVA test, ***p < 0.001.
