Figure 2.

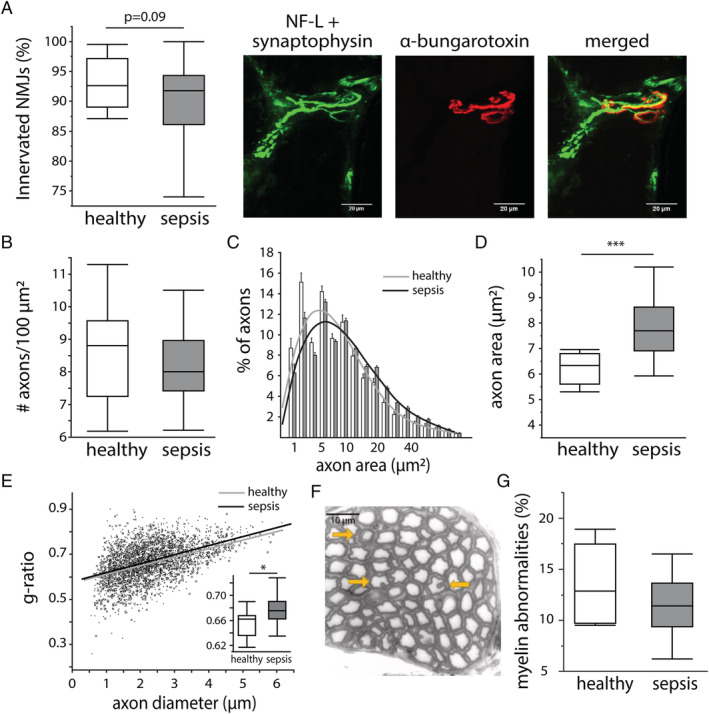
Effect of sepsis on markers of neuromuscular junction (NMJ) denervation, axonal degeneration, and demyelination. (A) Innervation of NMJs, quantified in the tibialis muscle as the percentage of NMJs with co‐localization of neurofilament light chain (NF‐L)/synaptophysin (neural synapses) and α‐bungarotoxin (neuromuscular endplate) staining. Scale bars are 20 μm. (healthy n = 12, sepsis n = 23) (B) The number of axons per 100 μm2, quantified as the median number per animal. (healthy n = 9, sepsis n = 20) (C) Histogram of the axon size and fitted curve. Bars are mean ± standard error of the mean. Grey line = healthy animals, black line = septic animals. (D) Quantification of the median axon size per animal. (healthy n = 9, sepsis n = 20) (E) The g‐ratio in relation to the axon diameter. Grey crosses + fitted grey line = healthy animals, black dots + fitted black line = septic animals. Insert graph shows the median g‐ratio per animal. (healthy n = 8, sepsis n = 20) (F) Myelin abnormalities (abnormal myelin thickness and in‐/out‐foldings) indicated with yellow arrows. Scale bar is 10 μm. (G) Quantification of the percentage of axons with myelin abnormalities. (healthy n = 8, sepsis n = 20) All axon/myelin analyses were performed in toluidine blue stained axons of the sciatic nerve. *P ≤ 0.05, **P ≤ 0.01, ***P ≤ 0.001.
